As the Perf-Tools team, we are responsible for the Firefox Profiler. This newsletter gives an overview of the new features and improvements we’ve done in Q3 2021.
This is our second newsletter and you can find the first one here which was about the H1 2021. With this newsletter, we wanted to focus on only Q3, so it would be less crowded and you can see the new features and improvements easily. I hope you enjoy the work that we’ve done this quarter.
Let’s get started with the highlights.
Network marker Improvements
We had network markers for a while and we had both a network track in the timeline and a network chart in the bottom panel. It was working fine for a while but it was lacking some functionalities. Also, we had some correctness issues around the markers, like sometimes we were missing some network markers. We’ve worked on this task to improve both the Firefox Profiler analysis page and also the correctness of the values in the back-end.
Here are some of the things that we’ve done:
Highlight network markers in both the timeline and the network chart
Previously, network markers in the timeline and network chart were independent. When you interacted with one, it wasn’t changing the other one. After this work, when you hover over a network marker, the same marker in the other part will be highlighted. Here’s an example:
Clicking a request in the network track selects the right line in the network chart
Previously, clicking on a network track wasn’t doing anything. With this work, if you click on a network request in the network track in the timeline, it will automatically select the network marker in the network chart. It is helpful for quickly finding the network request you are looking for.
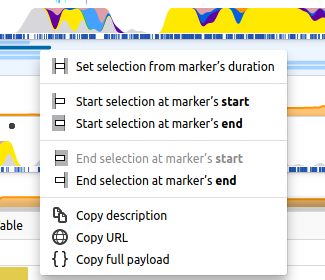
New context menu in the network track
We have a context menu for the network chart in the bottom panel, but we didn’t have one in the timeline network tracks. We’ve added the context menu to the network tracks now and they can be used as the same. We are hoping that with this and other network track works, network track will be a lot more useful.
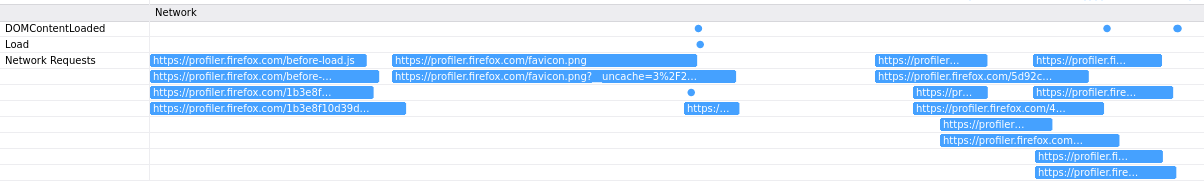
Display network markers in the marker chart
We’ve started to show the network markers in the marker chart as well. It could be helpful when you are also looking for other markers and want to align the network markers with them.
Support for network requests cancellations
This is one of the improvements that we made in the back-end to make the data more consistent and accurate. Firefox profiler didn’t support the network request cancellations on service workers before. Now, you can see if a network request is being canceled and when.
Profiling overhead reductions
Reducing the overhead of profiling Firefox sleeping threads
Previously, we were doing some costly operations for sampling even when a thread is idle. With this work, we’ve reduced the overhead of profiling the sleeping thread dramatically. I’m not going to get into the details of this improvement since our colleague Gerald Squelart wrote a great blog post about it already. You can take a look at it here if you are curious about the optimization he came up with and the implementation details.
Reducing the overhead of Firefox Profiler recording by reducing mutex lockings
Firefox Profiler has an internal mutex inside of it. It is being used so other threads can modify the same data without any data loss or data race. But this mutex brings some overhead because when two threads need to add a marker at the same time, they both need to acquire the mutex lock. In that case, one of them had to wait for the other one. And this was bringing some overhead because of this mutex lock waiting time.
With this work, we’ve removed the need for mutexes from lots of places, including most importantly from marker recording sites.
Rust API for Firefox Profiler
Firefox Profiler has some APIs for various languages like C++, JavaScript, and Java/Kotlin inside the mozilla-central codebase. We also had some hacks around the Rust codebases, but they were added for each Rust project when they were needed and we had lots of code duplication because of it. Also, they weren’t maintained by the Firefox Profiler team and they were prone to misuse. With this work, we’ve created a canonical Rust API for the Firefox Profiler and removed all the code duplications/hacks around the codebase.
We have three main functionalities with this API:
- Registering Rust threads:
- With this functionality, you can register a Rust thread, so Firefox Profiler can find it and possibly profile it. It’s good to keep in mind that only registering a thread will not make it appear in the profile data. In addition, you need to add it to the “Threads” filter in about:profiling.
We had some hacks around the thread registration for Servo and WebRender threads, so we could profile them. But they were duplicated and were using the raw FFI bindings.
- With this functionality, you can register a Rust thread, so Firefox Profiler can find it and possibly profile it. It’s good to keep in mind that only registering a thread will not make it appear in the profile data. In addition, you need to add it to the “Threads” filter in about:profiling.
- Adding stack frame labels:
- Stack frame labels are useful for annotating a part of the call stack with a category. The category will appear in the various places on the Firefox Profiler analysis page like timeline, call tree tab, flame graph tab, etc.
- Adding profiler markers:
- Markers are packets of arbitrary data that are added to a profile by the Firefox code, usually to indicate something important happening at a point in time, or during an interval of time.
We also have documentation about this API in the Firefox source docs. Please take a look at it for more details and examples if you are interested. Also, we are going to be writing a blog post about this API soon. Stay tuned!
Show the eTLD+1 of Isolated Web Content Processes as their track name
The timeline of the Firefox Profiler analysis page is very crucial to finding the data we are looking for. Inside the timeline, we have various registered processes and threads that Firefox had during the profiling session. When we have lots of tracks in the timeline, it might be hard to figure out which track we are interested in.
Previously, all the web content processes had a single name called “Web Content” or “Isolated Web Content” (when Fission is enabled). This is not explicit when it comes to figuring out a specific tab. This was implemented this way before because there wasn’t a way to determine the tab URL for a specific “Web Content” process. But with Fission, we precisely know which process belongs to which eTLD+1. After this work, we’ve started to show their eTLD+1 as their track name. This way, it will be a lot easier to determine which track you are looking for.
Here’s an example of before and after:
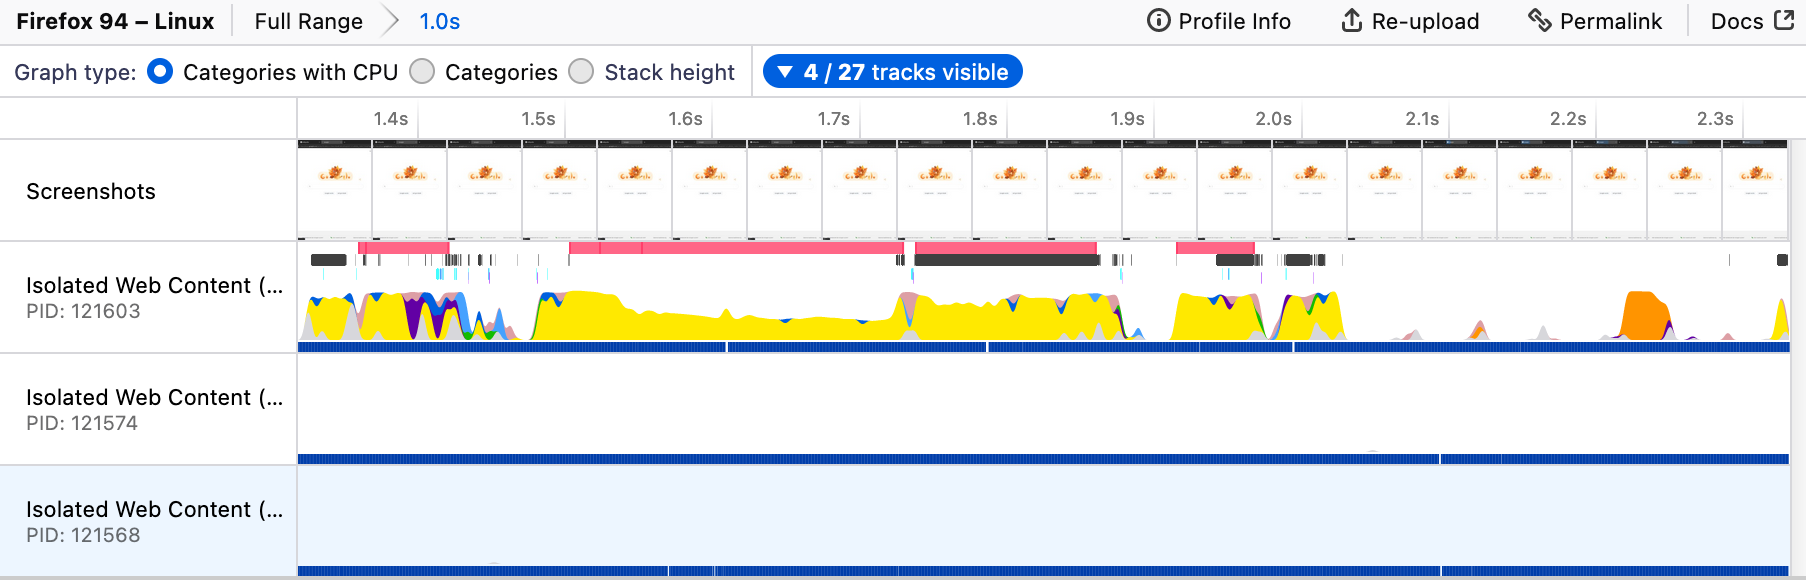
Before
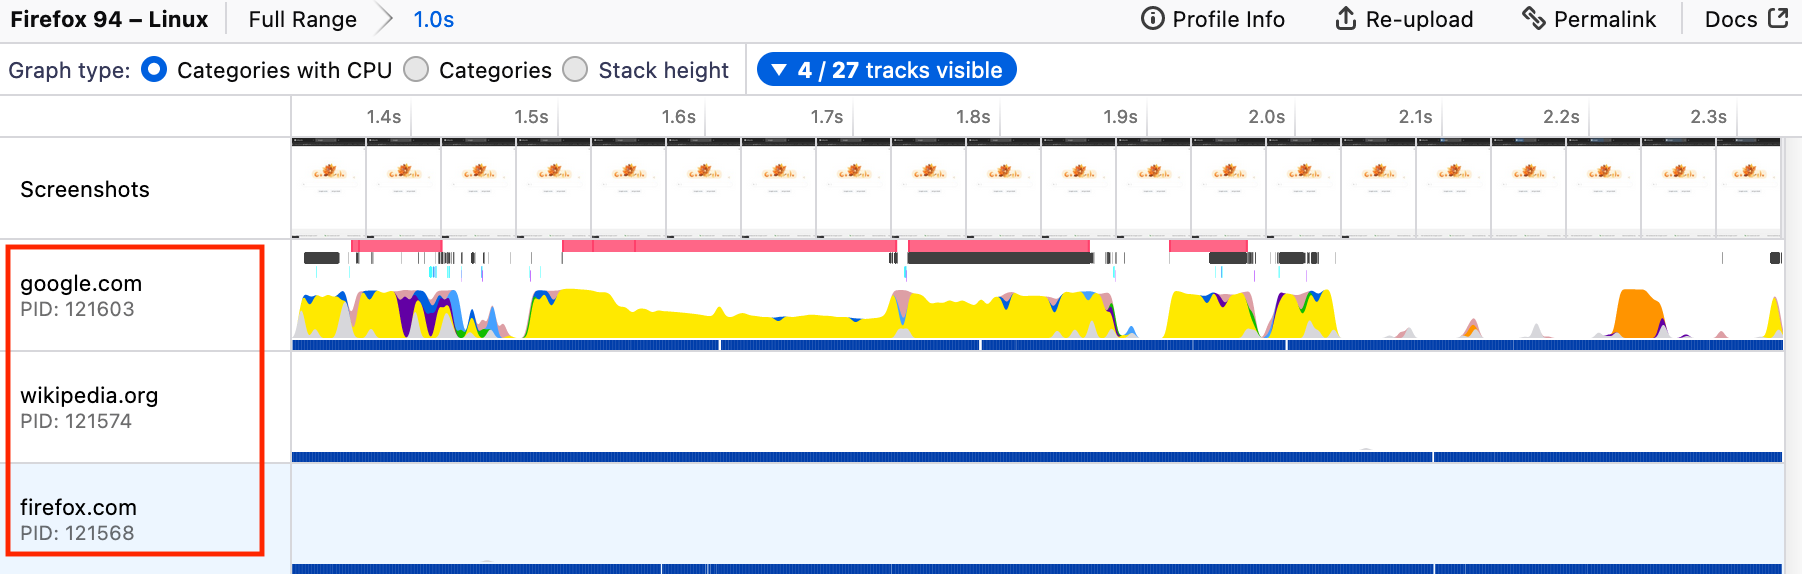
After
Linux perf importer improvements
Firefox Profiler had Linux perf support for quite some time. We have this documentation about how to profile with it and how to import it.
Our contributor, Mark Hansen, made some great improvements on the Linux perf support to make it even better. Here are the things Mark Hansen improved:
- Add support for Linux perf profiles with a header.
- Firefox Profiler can import the profiles directly when the user records a profile with `perf script –header`. Previously it was giving an error and the header had to be removed.
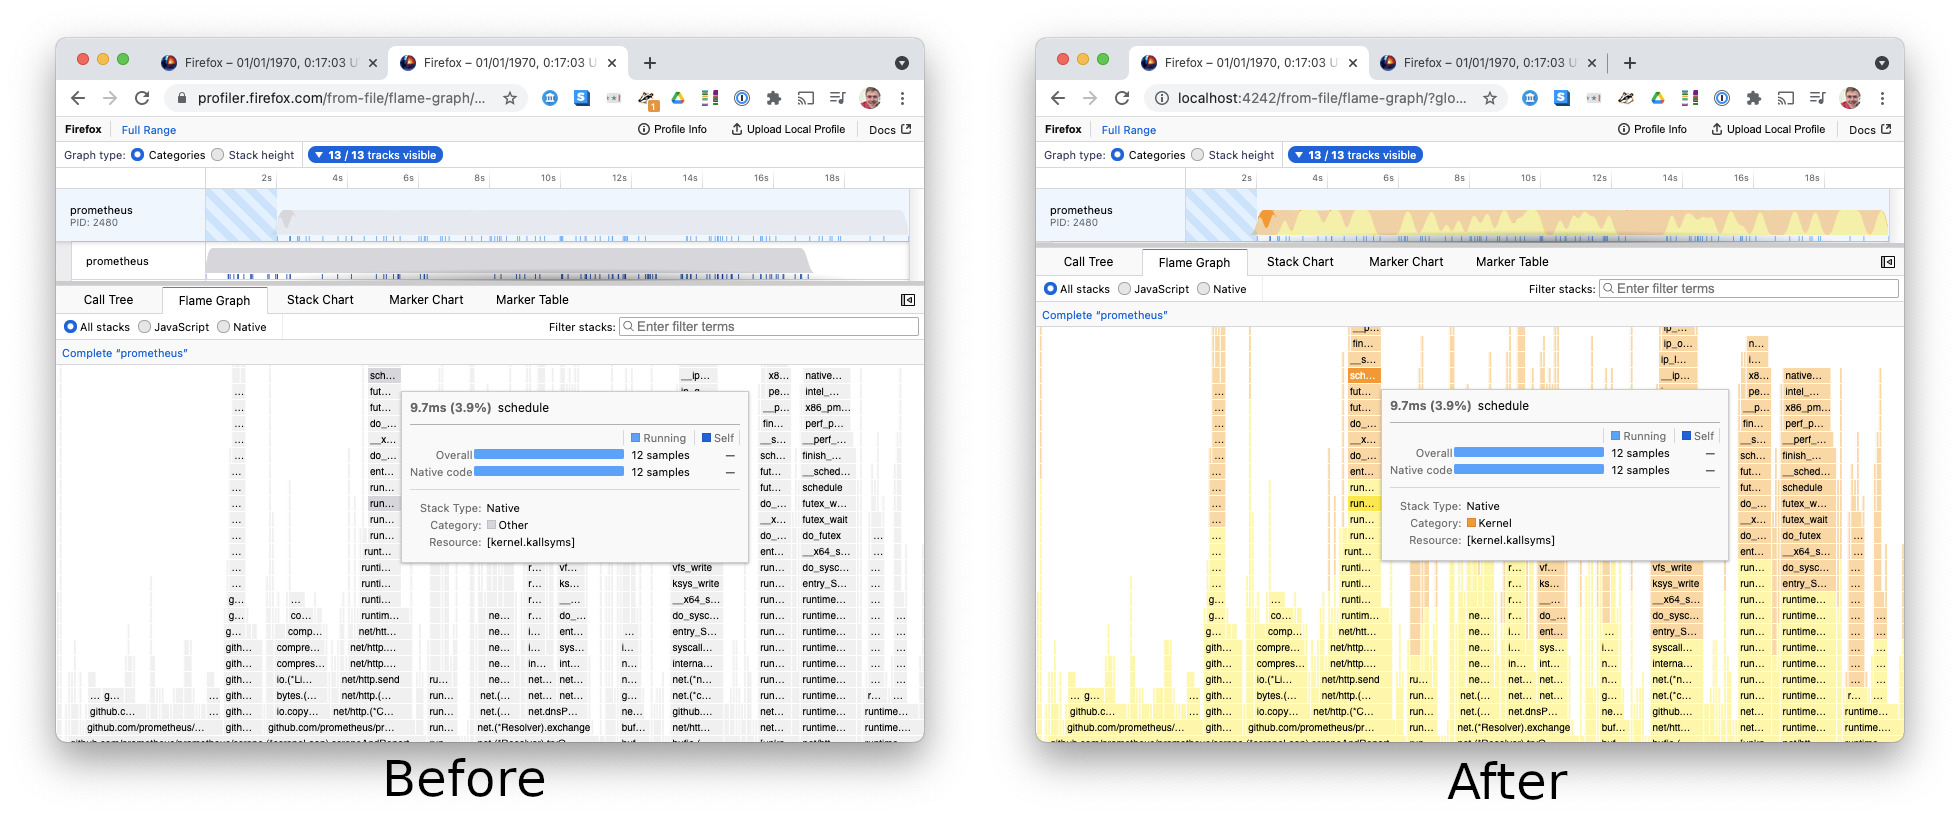
- Add categories and colors to our Linux perf importer.
- In the Firefox Profiler, we have various profiling categories for annotating different parts of the code. For example, we have JavaScript, DOM, Network, etc. For the Linux perf profiles, we didn’t have any specific categories, so all the samples were marked as “Other”. With this work, we now have two categories for kernel and non-kernel native code. Here’s a before and after:
 Also, he wrote an awesome blog post about this work. You can find it here.
- In the Firefox Profiler, we have various profiling categories for annotating different parts of the code. For example, we have JavaScript, DOM, Network, etc. For the Linux perf profiles, we didn’t have any specific categories, so all the samples were marked as “Other”. With this work, we now have two categories for kernel and non-kernel native code. Here’s a before and after:
Support for dhat imports
Firefox Profiler now supports imports of dhat memory profiles. “dhat” is a dynamic heap analysis tool that is a part of the valgrind tools. It’s useful for examining how programs use their heap allocations. After this work, all you need to do is to drag and drop the dhat memory profile file into the Firefox Profiler and it will automatically import everything and load it for you.
Other updates
- Localization of the Firefox Profiler
- We’ve finished the internationalization work of the Firefox Profiler analysis page in the H1 with the help of our Outreachy intern. And we were working with the l10n team to localize the Firefox Profiler.
In Q3, we’ve enabled 12 locales in total, and we hope to add more once the locales under development reach a certain limit! Here are the locales that we enabled so far:
de, el, en-GB, es-CL, ia, it, nl, pt-BR, sv-SE, uk, zh-CN, zh-TW.
If you want to help translate the Firefox Profiler to your language, you can do that by visiting our project on Pontoon.
- We’ve finished the internationalization work of the Firefox Profiler analysis page in the H1 with the help of our Outreachy intern. And we were working with the l10n team to localize the Firefox Profiler.
- Compare view shows the profile names as the track names
- Previously the compare view was only showing Profile 1 and Profile 2 as the profile names. Now, it will display the name if it’s provided in the profile link.
- Create more compact URLs for profiles with lots of tracks
- Firefox Profiler keeps most of the data persistent in the URL, so when you share the link with someone else, they will see the same thing as you see. But that brings some challenges. Because there is a lot of data to keep track of, the URL sometimes ends up being really long. We are using bitly to shorten the URLs, so you don’t have to worry about long URLs. But when the URL is too long, bitly fails to shorten it and you are stuck with the long URL. With this work, we’ve made the URLs more compact, to ensure that we will never fail to shorten them.
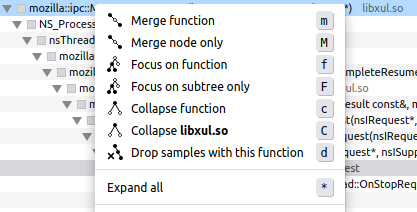
- Updated “Expand all” menu item to include its shortcut key
- We have an “Expand all” menu item in the call tree context menu. It has a shortcut key as “*” but that wasn’t really visible before. Now, we are showing the shortcut on the right side of the menu item, so you can learn it by just looking at the context menu.
This is implemented by our contributor Duncan Bain. Thanks, Duncan!
- We have an “Expand all” menu item in the call tree context menu. It has a shortcut key as “*” but that wasn’t really visible before. Now, we are showing the shortcut on the right side of the menu item, so you can learn it by just looking at the context menu.
- When a window is closed, its screenshot will stop showing up in the timeline at the point of window destruction.
-
- Our screenshots were always showing like a window is always open even though it’s being destroyed already. Now, we know when a window is being destroyed and stop showing the screenshots of that window.
-
Contributors in Q3 2021
Lots of awesome people contributed to our codebases both on GitHub and mozilla-central in. We are thankful to all of them! Here’s a list of people who contributed to Firefox Profiler code:
- Duncan Bain
- Florian Quèze
- Gerald Squelart
- Greg Tatum
- Julien Wajsberg
- Mark Hansen
- Markus Stange
- Michael Comella
- Nadinda Rachmat
- Nazım Can Altınova
And here’s a list of contributors who helped on the localization of Firefox Profiler:
- Brazilian Portuguese: Marcelo Ghelman
- British English: Ian Neal
- Chilean Spanish: ravmn
- Chinese: Gardenia Liu, hyperlwk, 你我皆凡人
- Dutch: Mark Heijl
- German: Michael Köhler
- Greek: Jim Spentzos
- Interlingua: Martijn Dekker, Melo46
- Italian: Francesco Lodolo
- Kabyle: Selyan Slimane Amiri, ZiriSut
- Swedish: Andreas Pettersson, Luna Jernberg, Peter Kihlstedt
- Taiwanese Chinese: Pin-guang Chen
- Ukrainian: Artem Polivanchuk, Lobodzets, Іhor Hordiichuk
Thanks a lot!
Conclusion
Thanks for reading! If you have any questions or feedback, please feel free to reach out to me on Matrix (@canova:mozilla.org). You can also reach out to our team on Firefox Profiler channel on Matrix (#profiler:mozilla.org).
If you profiled something and are puzzled with the profile you captured, we also have the Joy of Profiling (#joy-of-profiling:mozilla.org) channel where people share their profiles and get help from the people who are more familiar with the Firefox Profiler. In addition to that, we have the Joy of Profiling Open Sessions where some Firefox Profiler and Performance engineers gather together on a Zoom call to answer questions or analyze the profiles you captured. It’s usually happening every Monday, and you can follow the “Performance Office Hours” calendar to learn more about it.
No comments yet
Comments are closed, but trackbacks are open.