Recently, we had an odd regression in our page load tests. You can find that bug here. The regression was quite large, but when a developer investigated, they found that the regression looked more like an improvement.
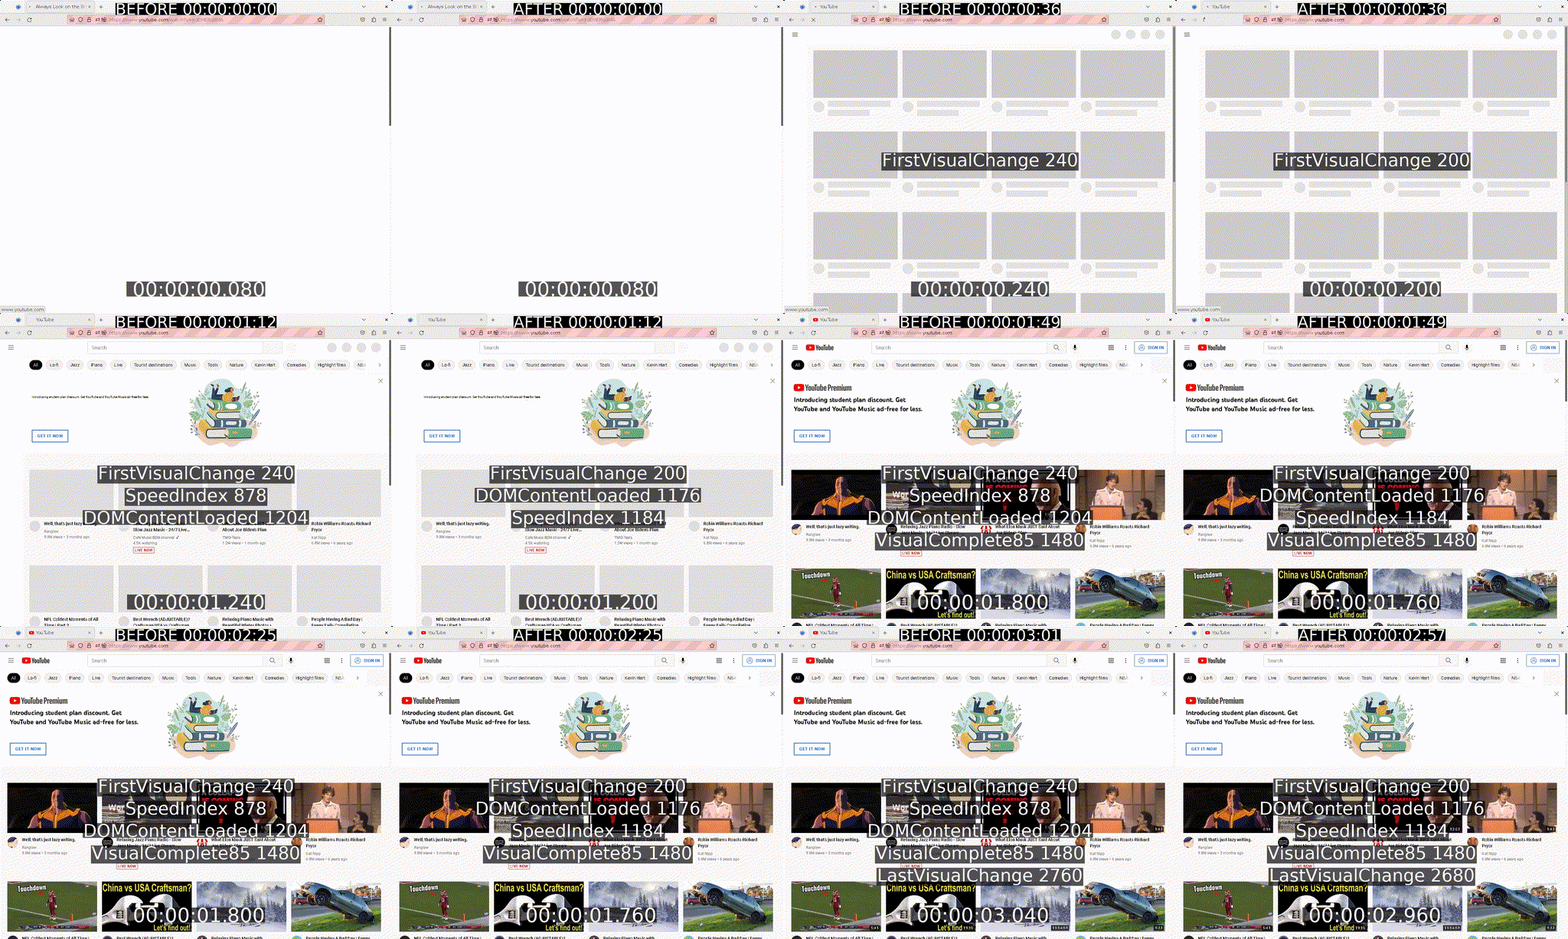
Below you can see an example of this, and note how the SpeedIndex of the Before video shows up before the page is loaded. You can also see that in the After video the page seems to load faster (less frames with gray boxes) even though we have a higher SpeedIndex.

Side-by-side of a regression that is actually an improvement
These are side-by-side videos that were recently introduced by Alexandru Ionescu, you can read about it more here. They are very useful to use when you’re trying to visually understand, or find, the exact change that might have caused a regression or improvement. I used this command to generate them locally:
./mach perftest-tools side-by-side \
--base-revision 10558e1ac8914875aae6b559ec7f7eba667a77a7 \
--new-revision 57727bb29f591c86fd30724b9ec8ebcb4417a3e2 \
--base-platform test-linux1804-64-shippable-qr/opt \
--test-name browsertime-tp6-firefox-youtube
When I ran the visual metrics processing for these videos locally with verbose mode enabled (with -vvvv) I found that the visual progress in the Before video jumped immediately to 49% on the first visual change! You can find those numbers in this bug comment.
I spent some time looking into this bit of code that calculates the progress percentage above on a frame-by-frame basis. This progress is calculated as the difference between the current frame’s histogram, and the final frame’s histogram. It also uses the initial, or start, frame as the baseline of the progress measurement. The original code is an optimized approach at calculating the differences of the histograms that only considers channel intensity values that changed. It’s difficult to say if this is worthwhile given that we generally have a small number of frames to process at this point. These frames have been de-duplicated so at this stage we only have unique frames that should be visually different from each other (when looked at sequentially). That said, this isn’t an issue. The actual issue lies in the usage of a “slop” or another word for fuzz.
In other areas of code we find fuzz being used extensively, and for good reason too. From what I’ve been able to find, this variance in our pixel intensities is coming from an archiving process that the videos undergo. Regardless of the exact reason(s), it needs to be handled appropriately in the processing script. However, this variance is primarily visible in the pixel intensities. If we break apart the pixel intensity into its components and analyze them separately, then we’ll find the fuzz appearing as some X% variance between the histograms. If we assume a 10% variance in pixel intensities, then this means we would need to incorporate +-10% of the histogram pixel values (or bins) around a given pixel value. But what portion of those +-10% histogram bins should be incorporated? Should the entire thing be incorporated? Should we only look at the minimum between the current value and the other value? The latter is what the original visual metrics processing script has chosen to do.
While it’s a reasonable approach, some questions appear about the validity of the results like how do you know the bins you’re looking at have variance, and how do you know you’ve incorporated the correct amount of the other bins. However, the biggest, and in my opinion, most illuminating question for why using a fuzz-based methodology here is highly problematic is: how do you know you’re not mixing colours together? For example, a pure red colour withrbg(240, 0, 0), would end up being mixed with a light grey with rbg(245, 245, 245) in the original implementation. If we’re currently mixing up large ranges of values like this together, then the fuzz implementation isn’t working as intended, and that’s what we were seeing in the video above. The grey boxes are mixing with the other colours/bins to produce a higher progress percentage at an earlier time which gives us a lower overall SpeedIndex score. The proper way of having a fuzz at this stage would be to look at the actual individual pixel intensities instead of breaking them up into the channel components. Given that that would be a difficult change to make since it would involve changing how the histograms work, I implemented a simpler approach that only takes the differences of the histograms and doesn’t incorporate any fuzz into the implementation. I based it off of an implementation of frame progress by the speedline JS module.
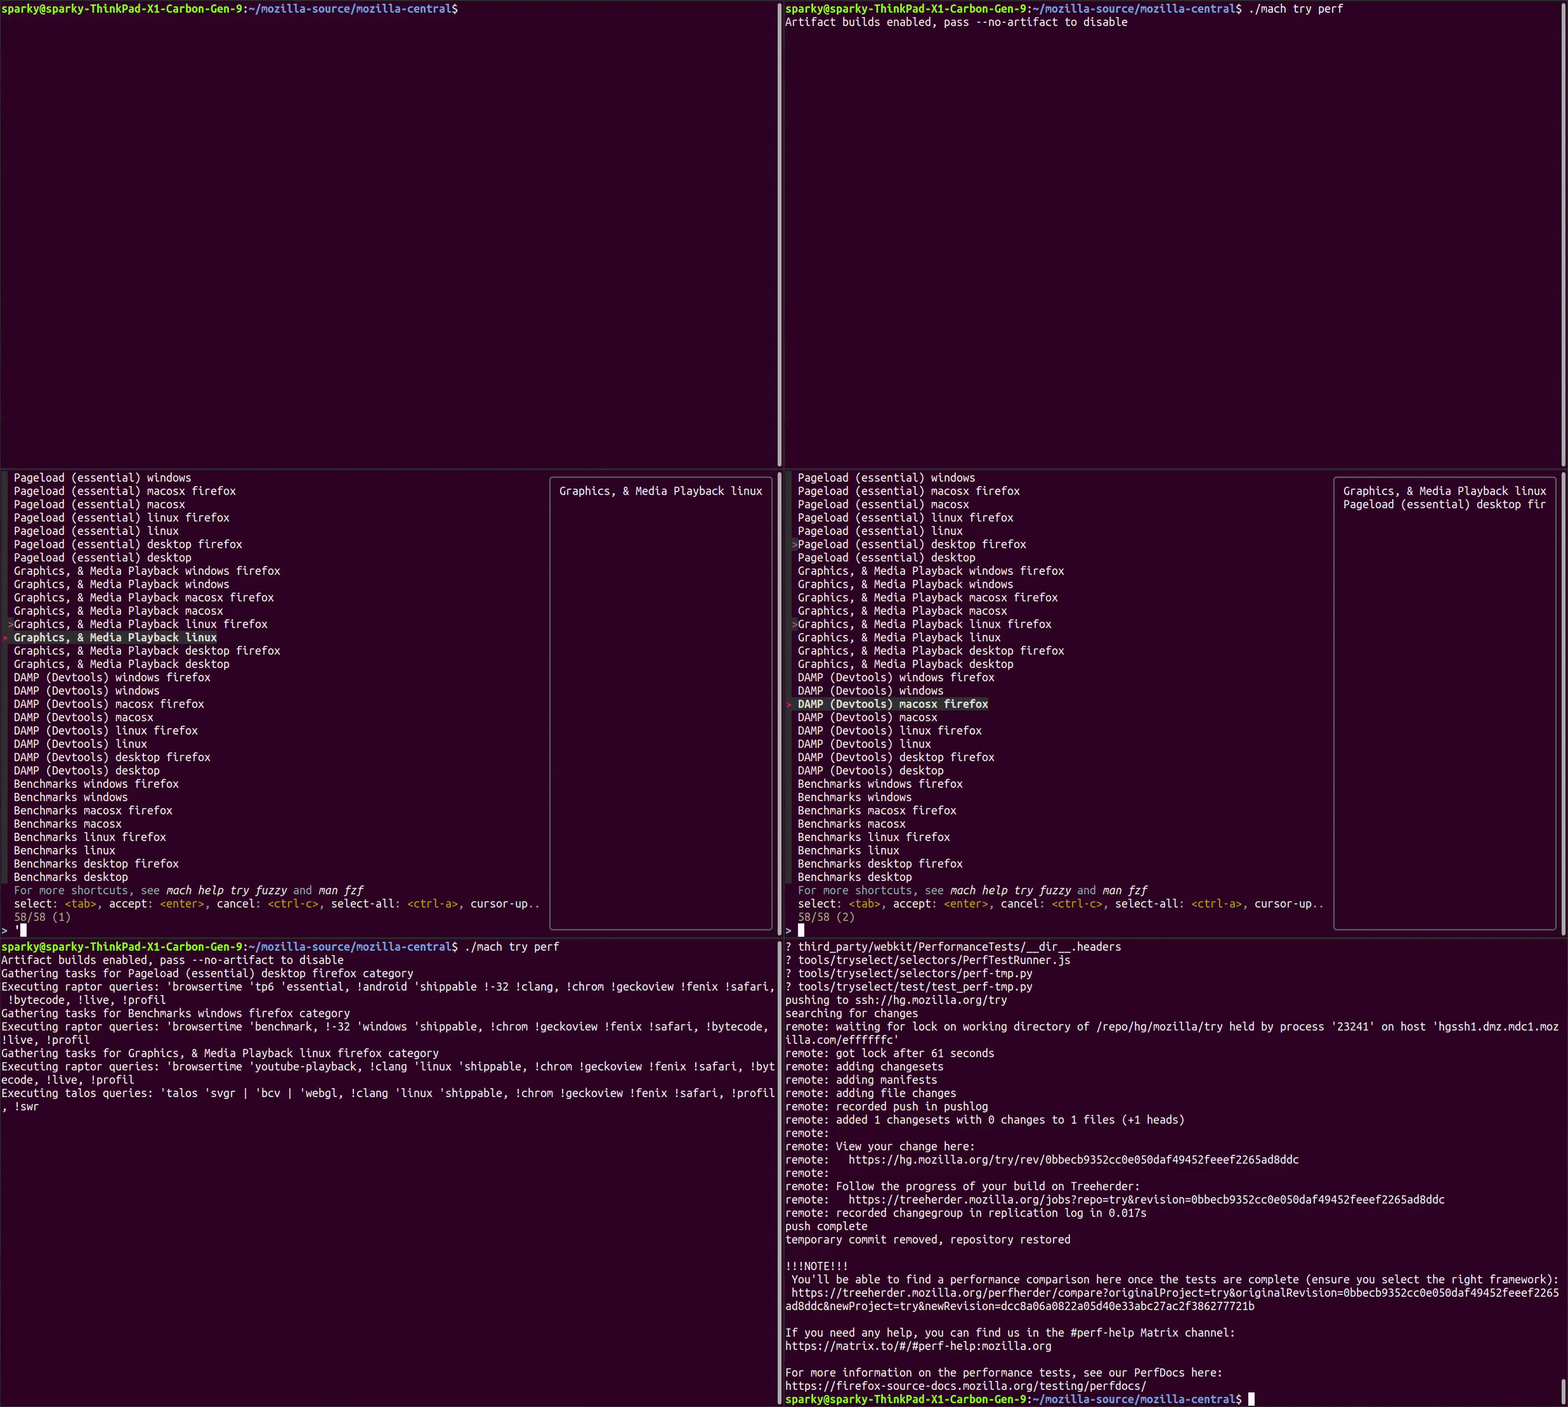
Locally, I was able to fix the regression, and the results looked much better. The change has landed in the main Browsertime repository and it’s also been fixed in mozilla-central. In the process of performing the update, I ran a performance metric comparison using ./mach try perf to determine what kind of changes we could expect from this and found that overall we should see a reduction in the variance of our metrics. This fix will also regress most of the metrics since the progress is going to be lower at an earlier time in most, if not all, tests.
Something interesting to note is that this ancient bug has existed for over 8 years, or since the beginning of time relative to the file! It was introduced in the first commit that added the visual-metrics processing code here. While this fix is a small change, it has a large impact because all of the *Index metrics depend on this progress. We hope to continue finding improvements like this, or target some larger ones in the future such as reworking how the fuzz factor is used across the script since it also produces issues in other areas.
If you have any questions about this work, feel free to reach out to us in the #perftest channel on Matrix!


No comments yet
Comments are closed, but trackbacks are open.