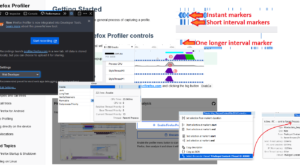
What is the Firefox Profiler?
The Firefox Profiler is a performance analysis tool designed to help developers understand and optimize the performance of websites and Firefox itself. It allows you to capture detailed performance profiles and analyze them in the profiler.firefox.com analysis view. If you haven’t used it yet, head over to profiler.firefox.com to enable it and learn more about its capabilities!
A New Way to Import Chrome Traces
Previously, if you wanted to analyze Chrome traces in the Firefox Profiler, the process was a bit tedious. You had to manually download the trace as a JSON file, then drag and drop it into the profiler to load it up. While this worked, it wasn’t ideal, especially if you needed to repeat this process multiple times. To solve this, we’ve developed a Chrome extension that streamlines the entire workflow. You can download the extension from the Chrome Web Store.
With this new extension, capturing and importing Chrome traces is simple and quick. Click on the profiler icon in the toolbar to start and stop Chrome’s internal profiler and capture a profile, or use the shortcut Ctrl+Shift+1 to start and Ctrl+Shift+2 to stop and capture. Once the trace is captured, it automatically opens in Firefox Profiler’s analysis view, ready for you to investigate. No more downloading files or dragging and dropping!
Collaboration Made Easy
One of the best features of the Firefox Profiler is its ability to make collaboration effortless. Once you’ve captured and analyzed a profile, it remains completely offline and is not uploaded to any server until you decide to share it. You can share it with your teammates by clicking the upload button in the top-right corner. This lets you remove any personal information before uploading. Once uploaded, the profiler generates a permalink that preserves the exact view you were analyzing. This means the person you share it with can see exactly what you’re seeing, making debugging and performance discussions much simpler.
Why This Extension Matters
This extension isn’t just about convenience, it opens up new possibilities for cross-browser performance comparisons. By making it easy to capture and analyze Chrome traces in the Firefox Profiler, developers can now compare performance across browsers side by side. This is especially useful for ensuring a consistent user experience across different platforms. Whether you’re optimizing rendering performance or debugging a specific issue, having a unified way to analyze performance is incredibly helpful.
What’s Next?
We’re excited to see how this extension helps you in your workflows. While it offers significant benefits like its collaboration features and different data visualizations, it’s worth noting that some features, such as network markers, are not fully supported yet. We’re committed to improving it further, and we hope the extension becomes a helpful tool for you.
Download the extension today from the Chrome Web Store, and let us know what you think! If you have any feedback or encounter any issues, feel free to reach out in the Firefox Profiler Matrix channel (#profiler:mozilla.org) or file a bug on our GitHub repository. We’d also love to hear how you’re using the profiler for cross-browser performance comparisons!
Thanks for reading, and happy profiling!


No comments yet
Comments are closed, but trackbacks are open.