The Free and Open source Software Developers’ European Meeting (FOSDEM) 2023 took place on the 4th and 5th of February. This was the first in-person FOSDEM since 2020, and for this reason, coming back to the good ol’ ULB building felt very special. The event was just like we left it in 2020: lots of people, queues in front of the most popular rooms, queues for the food trucks, mud, booths, many many developer rooms and talks to see, and this was just like a reunion between old friends.
As the Profiler team is very distributed, just like the rest of Mozilla, it’s been also great seeing each other again, living this event together, and strengthening our relationships around some carbonade flamande, meatballs, waffles, and (edible) mushrooms.
The Firefox Profiler was very much represented there, with no less than 5 talks in 3 different rooms!
Here is a quick overview of these talks as well as links to the slides and videos.
Using the Firefox Profiler for web performance analysis, by Julien Wajsberg
The talk took place in the JavaScript room, at the very last slot on Sunday.
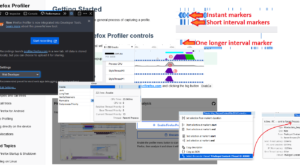
This was mostly an introduction talk about the Firefox Profiler. Julien talked about what a profiler is, described how to capture a profile, and showed how to navigate in the Firefox Profiler UI like a pro. He explained that measuring is always better than guessing in the performance world.
You can find the slides by following this link.
And here is the full video:
What’s new with the Firefox Profiler, by Nazım Can Altınova
This talk took place in the Mozilla room, on Saturday afternoon.
Nazım described all the new things that happened in the past year: new importers, power profiling, and other improvements in the UI interface.
You can look at the slides by following this link.
Power Profiling with the Firefox Profiler, by Florian Quèze
This talk took place in the Energy room, on Saturday afternoon.
Florian explained the process that led him to implement this feature directly in the Firefox Profiler. Then he went on to show how to use it, and even shared some examples and findings thanks to this new feature.
You can find the slides by following this link.
And here is the video:
Florian gave another talk related to the energy use in Firefox, mentioning the Firefox Profiler among other things. You can read more about this talk on its dedicated page.
Firefox Profiler beyond the web, by Johannes Bechberger
This talk happened in the Mozilla room, on Saturday afternoon.
In this talk, our contributor Johannes shared how he came to contribute to the Firefox Profiler for his own use case: implementing a full-featured profiler for Java programs, based on Java Flight Recorder (JFR), and integrating it fully in IntelliJ IDEA.
You can watch the video below:
Johannes also shared his work extensively in two posts on his blog where you can read more.
Other talks
The team also went and see some interesting talks that you might want to check out:
- All other talks in the Mozilla room, of course 😁. There’s a handy Youtube playlist with all Mozilla-related talks that happened at FOSDEM if you’re interested.
- Stack walking/unwinding without frame pointers in the binary tools room (also in the kernel room) by Vaishali Thakkar and Javier Honduvilla Coto. This is a topic that we had to address in the Firefox Profiler as well… but we did it differently 😏.
- Graphing tools for scheduler tracing by Julia Lawall in the kernel room. This talk gave us ideas about visually representing task scheduling in Firefox too.
- Reimplementing the Coreutils in a modern language (Rust) by Sylvestre Ledru in the Main track in the K Building. Seeing how an open-source project rises from a one-person hobby to being used in commercial projects was quite inspiring.
- Teaching machines to handle bugs and test Firefox more efficiently by Marco Castellucio in the Main track in the Janson amphitheater. This showed how machine learning can save us time for tedious tasks.
- Contributor Growth Strategies for OSS Projects by Dr. Dawn Foster in the Community room. As the profiler is an open-source project, getting ideas about how to handle this open-source aspect is useful.
- Getting to a fossil-free internet by 2030 by Chris Adams in the Energy room. It’s good to mention that Chris contributed some code in the Firefox Profiler to show the CO₂ equivalent of energy usage. He’s mentioning this work in his talk.
Conclusion
The Profiler team was very glad to be part of this edition. We felt lucky that we could share so much content with the public, and we’re sharing those here in the hope that they might be useful to more people.
As always, if you have any questions or feedback, please feel free to reach out to our team on the Firefox Profiler channel on Matrix (#profiler:mozilla.org), we’d be glad to get feedback and suggestions from you.







No comments yet
Comments are closed, but trackbacks are open.