It will come as no surprise that playing video and audio in a web browser requires a certain attention to performance. Whether it is by getting the design right, using good implementations of codecs (potentially with hardware acceleration), taking care of using memory properly and avoiding unnecessary copies, or ultimately micro-optimizing some particular hot paths using flashy assembly routines or a clever algorithm, a good experience for an end user doesn’t come without hard work.
It’s well known that it’s quite hard for a programmer to know ahead of time what part of a program is going to be expensive in terms of CPU, if possible at all. Software profiling, the practice of measuring the performances of a software while it’s running, and often doing a specific task in a specific environment is essential for producing good quality software in the first place, and to verify that optimizations are, in fact, making things faster.
Moreover, the web platform being particularly flexible, it’s quite possible that a web developer uses a particular feature in a way that the implementor and the specification author didn’t anticipate. In those instances, it happens that the browser code is not optimal (or really slow, up to the point of being unusable), and reporting the bug to the developers of the web browser is much appreciated.
Finally, browsers being widely used software that runs on a rather large range of hardware and operating systems, it’s expected that the experience of users varies (for example, attempting to play a 4k 60fps video might or might not work on old hardware with outdated drivers). If a developer has no way of reproducing the issue, nor a way to understand what is causing the problem, it becomes harder to fix the issue for the end user 1.
The Firefox Profiler
The Firefox profiler has been introduced years ago, and it has a few characteristics that make it extremely efficient to improve Firefox:
- It’s lightweight and can be run for long periods of time. It records its data into an in-memory ring buffer, and when a problem happens, if the user clicks the button to capture the profile, more often than not the issue has been captured.
- It can upload the recorded profile to a Mozilla server, with optional privacy scrubbing of course. Users have the choice of what they share with us with a clear set of check-boxes.
- It supports recording multiple-processes at once, which is critical in those time of multi-process browser and hardened sand-boxing.
- It supports tracepoints and the classic statistical profiling with stack unwinding, and supports interleaved JavaScript/WASM and native stacks interleaved, with full symbol demangling and automatic symbol decoding and matching, for builds released by Mozilla
- It also has advanced integration for important parts of a web browser: network requests, frame drops, garbage collection events, the main thread being blocked on something, and overall browser responsiveness
- A view of a particular profile can be shared (simply via the hash on the URL), so that we can discuss between Mozilla developers, and point to a particular location in a profile, for example via email or on chat.m.o
In addition it can import not only Firefox’s internal recording, but can also take a perf profiles as input (and maybe more system profilers in the future), recorded on other programs than Firefox, and the UI of the profiler is better than most other profiler UI, so it’s quite nice. But that’s a story for another post.
The Media preset
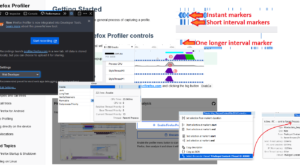
Going back to media, we of course use a certain amount of threads in Firefox, to have video and audio play smoothly while the user is using other tabs or interacting with the page. This makes it a bit hard to set up the profiler to record the right set of threads, with the right settings, especially for someone less technically inclined that a Firefox developer. The instructions used to look like this. On quite a few request to get profiles (on bugzilla, hacker new, randomly on reddit, etc.), only a handful people manageed to submit usable profile that allowed us to understand what was going on. We can’t blame anyone but ourselves for this; it’s not a user’s job to understand the innards of our software, and we can be nothing but grateful when they take time out of their day to report a problem they encountered.
But all this is over, since the introduction of profiling presets by my colleague Greg Tatum (with Julien Wasjberg on review duties, and I’m sure other people from their team). Let’s imagine I have a performance problem when seeking in videos on YouTube. To profile Firefox when it’s doing something that is media-related , here are now the complete steps, from a stock Firefox 2.
A few words about some specific steps in this video, with links:
- I start with a fresh Firefox Nightly, which is often better to check for performance issues (since it contains more code and therefore, often more fixes)
- At 0:06 I have loaded https://profiler.firefox.com and I click on the big button to show the profiling item in the tool bar. It’s also possible to activate it by going into the Customize button, and dragging it to the tool bar.
- At 0:09 I select the
Mediaprofiling preset (in my case it’s already selected, but I’m clicking the drop-down to show that there are other options for other use-cases) - At 0:16 I’ve loaded a web page I want to profile, and clicked the profiler button, to start profiling.
- Around the 20 seconds mark, I play and randomly seek in the video, as if I had a performance problem with seeking.
- At 0:31, I capture the profile. This stops profiling, and opens a tab where Firefox will display the profile
- At 0:38, the Firefox profiler symbolicates the profile (it knows I’m running a particular version of Firefox Nightly)
- At 0:43, I’m showing how to view the important threads for media playback, and I unfold the call stack until I find something that talks about
ffmpeg, that must be about decoding something - At 0:58, I’m uploading the profile, noting that some information can be removed from the profile (this is a simple test, I don’t un-tick any boxes). The upload step can be skipped and the profile downloaded (it has not left the machine at this point), and sent and loaded manually to another developer, for example via Firefox Send, which is encrypted.
- After some time (1:31), the profile URL is available, and I load it into a different browser tab.
Closing words
Sending the profile URL to a Firefox developer (for example on a Bugzilla ticket, on reddit, hacker news, or via email) immensely increases the chance that the problem will be fixed.
It is rare that a problem affects only one person when the number of users of your software is in the hundreds of millions. By reporting performance issues with profiles, anybody who has an interest in making the web better can contribute.
It’s rather easy to file a ticket on our Bugzilla instance. Logging in with a GitHub or Bugzilla account, and clicking the following link:
https://bugzilla.mozilla.org/enter_bug.cgi?product=Core&component=Audio%2FVideo
directly sends the bug to the media team, that triages regularly. They will reorient the ticket to the right people, that will then try to diagnose or debug. Adding a copy of about:support (type this in the address bar if you’re reading this in Firefox), and any weirdness about your setup goes a long way to have whatever your report fixed in an future release of Firefox.
On behalf of the media team, thanks in advance!
- But not impossible, there are lots of stories about crazy ideas lighting up in the head of developers in the middle of taking a shower while half awake, finding crazy connections between multiple subsystems to find a weird edge case that happened to be what was causing the issue. ▲
- I’m on macOS, but this is the same on all desktop platforms, mobile is also supported of course but the workflow is different since the Firefox being profiled is on a different machine than the Firefox displaying the profile. ▲


No comments yet
Comments are closed, but trackbacks are open.