Today at Mozilla, we constantly run “one-off” tests whose data always requires further analysis. The techniques used to analyze the data from these tests are quite similar to each other across the organization, with a small number of variations between them. These minute differences are problematic as it results in analysis reports which vary highly between individuals, and wasted developer resources as they are continuously solving the same problem in slightly different ways. Furthermore, trying to understand and explain results, when the report styles continuously change, wastes everyone’s time and resources, especially for management.
In the summer of 2019, we proposed an ambitious project, called “Mach Perftest Notebook”, that aimed to consolidate these various analysis techniques and visualization tools into a common format in an effort to:
- Reduce the waste of developer resources on analyzing and building visualizations.
- Simplify the consumption of analysis reports.
- Build a standardized methodology to minimize the possibility of errors in interpretation.
The existing tools available to us to accomplish this are numerous. But, we needed to use a visualization methodology that is simple, flexible, dynamic, modifiable after it’s initial creation, and includes the ability to be integrated into continuous integration (CI) in the future, or provides some combination of these features. The ability to modify an analysis report after it’s produced is desirable in certain situations, but it is not a necessary feature. Standardizing the basic analysis and visualization units is more than enough in most situations. Because of this, we chose to use various forms of “notebooks” for report/analysis visualization (i.e. Jupyter Notebook, R-Studio, Iodide).
The project was officially started in December 2019 in collaboration with two students from Bishop’s University in Lennoxville, Quebec (Yue Zhang [:yue], and Xuanqi Xu, or Adam [:axew1337]) who worked on this project for course credit. I was the primary mentor for them, but we had a lot of help from Kyle Lahnakoski [:ekyle], and Will Lachance [:wlach] on various pieces of the project. We decided to start with Iodide as the first notebook since it provides most of what we needed, and it’s a simple point to start from that provides great value. But given that users might want to use another tool/language for visualization of the analysis and the results, we chose to schedule R-Studio for the next notebook tool that would be implemented after Iodide.
A prototype was first built in this github repository and some of the challenges we hit were:
- Providing an interface to transform a user’s input into a standardized data format (hardest problem to solve).
- Providing a large enough variety of analysis types (as small units) to ensure proper coverage of basic techniques.
- The ability to chain these analysis techniques along with the ability to specify visualizations.
Challenges (2) and (3) are still in the process of being solved since they required us to be able to dynamically build and open notebooks in Iodide, and that the transformation code would be sufficient. I’m thrilled to say that at this stage, we are able to open notebooks in Iodide and reasonably transform the data which gives us an MVP that we could start using in practice. Adam worked with Will on the Iodide side of things, making it possible for us to open notebooks provided through a POST/GET request in Iodide (in the process of making it to the Iodide production instance). Yue worked with me to build up the transformation aspect of the code.
With the transformation code in place, and working well, we were able to make great use of the notebook in a new generic performance testing framework – that is currently in development (mozperftest) – to transform data produced by tests into a standardized form that the metric-specific modules can easily process. This integration officially brings the perftest-notebook out of the prototype phase. The next step for us now is to create a new command called mach perftest notebook so that users can make use of this tool in production. There are a couple things blocking this work for Iodide, so we’ve started pushing the R-Studio notebook forward here.
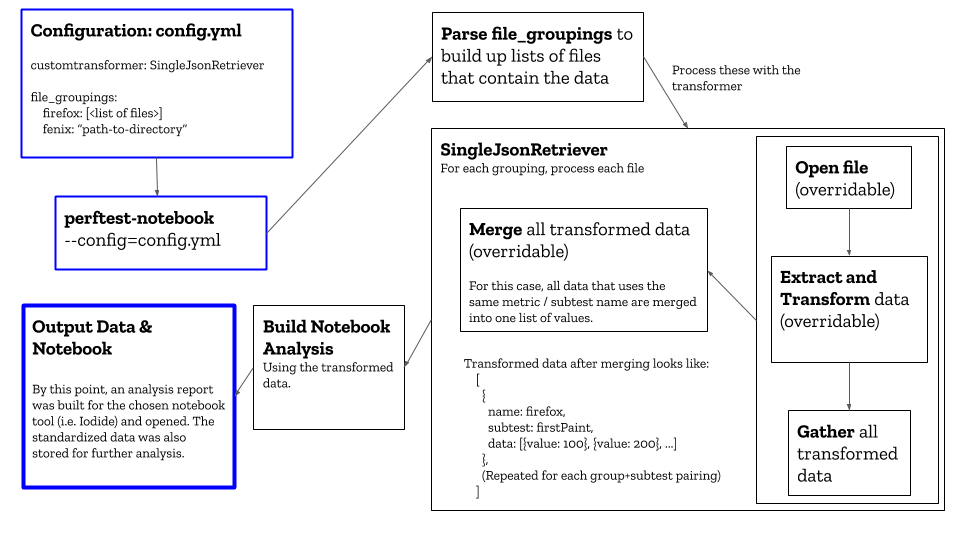
You can see a simplified diagram of how the perftest-notebook tool works below (or here if the image isn’t being displayed properly). This gives an idea of how we solved the data standardization problem as well which was the most difficult and most important aspect of this project:

I’d like to thank all the people who have been involved in this project from conception to its in-tree integration: Kyle Lahnakoski [:ekyle], Will Lachance [:wlach], Xuanqi Xu / Adam [:axew1337], Yue Zhang [:yue], Andrew Creskey [:acreskey], Nick Alexander [:nalexander], and Corey Dow-Hygelund [:cdowhygelund].
This won’t be the last time you hear of this project since it’s in active development. In the next post, I’ll describe the notebook analysis aspect of this tool – stay tuned!
If you have any questions, feel free to reach out to us on Riot in #perftest.


No comments yet
Comments are closed, but trackbacks are open.