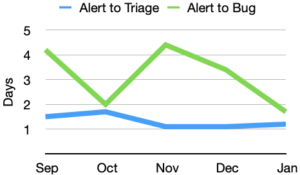
In January there were 106 alerts generated, resulting in 15 regression bugs being filed on average 4.3 days after the regressing change landed.
Welcome to the January 2021 edition of the performance sheriffing newsletter. Here you’ll find the usual summary of our sheriffing efficiency metrics, followed by some analysis of the bug products and components that were identified as the cause of regressions in 2020. If you’re interested (and if you have access) you can view the full dashboard.
 Sheriffing efficiency

- All alerts were triaged in an average of 1.2 days
- 90% of alerts were triaged within 3 days
- Valid regressions were associated with bugs in 1.7 days
- 100% of valid regressions were associated with bugs within 5 days
Regression Bug Analysis
January was a quiet month for alerts, so I thought I’d share some analysis I performed recently on the performance regression bugs identified in 2020. Note that this analysis is biased towards areas we have test coverage, areas of active development, and areas that are sensitive to performance.
Products
To create the following chart, I collected the product/component of all bugs indicated as a regressor for regression bugs. Where no regressor bugs were given, I report the product/component of the regression bug itself.
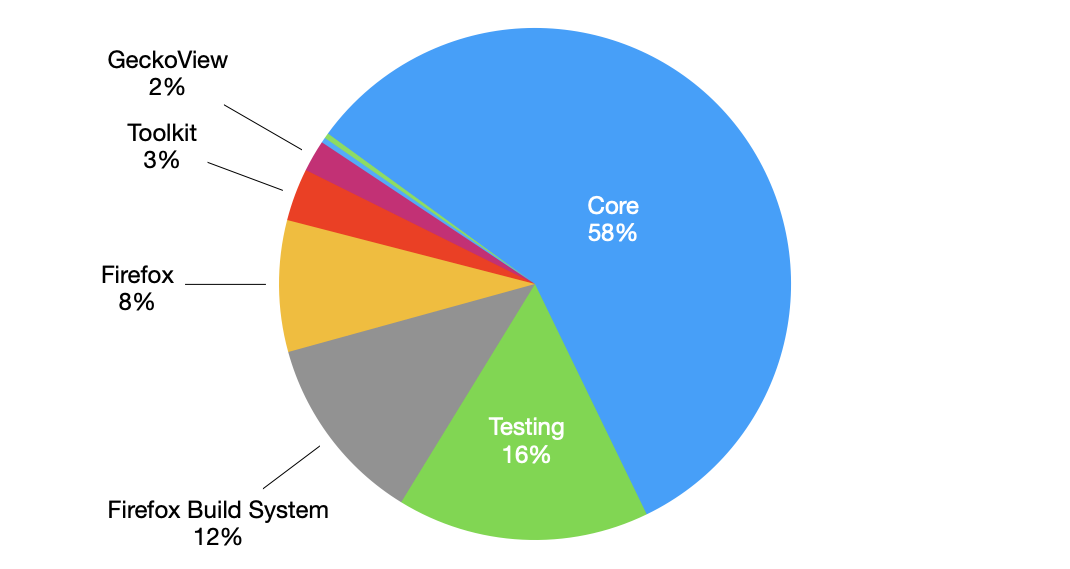
Perhaps unsurprisingly, the majority of the regression bugs were opened against the Core product. The 16% in the Testing product is likely caused by Testing::Performance being the default product/component for regression bugs.
Components
First, let’s take a look over the components within the Core product:
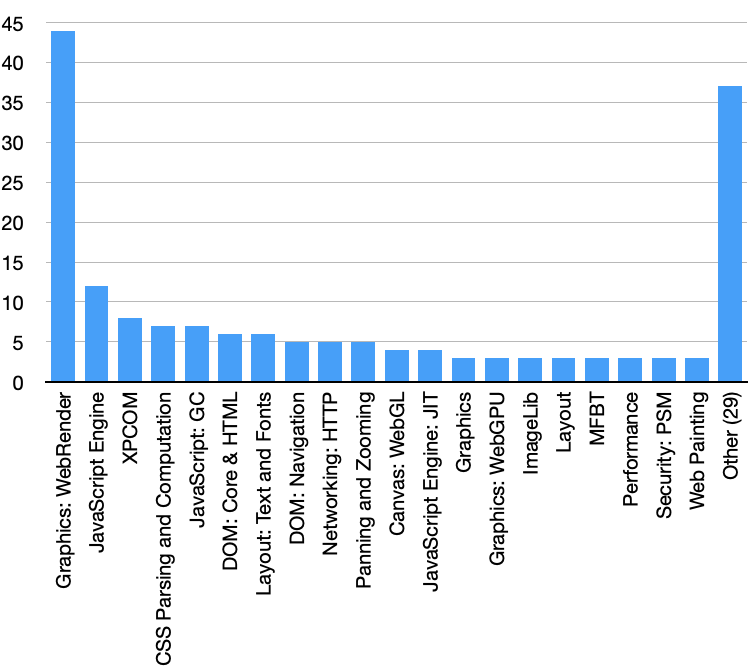
To conserve space, and ensure the above chart is readable, I’ve grouped 29 components with 2 or fewer regression bugs into an “Other” category. Now let’s look at the components that fall outside of the Core product:
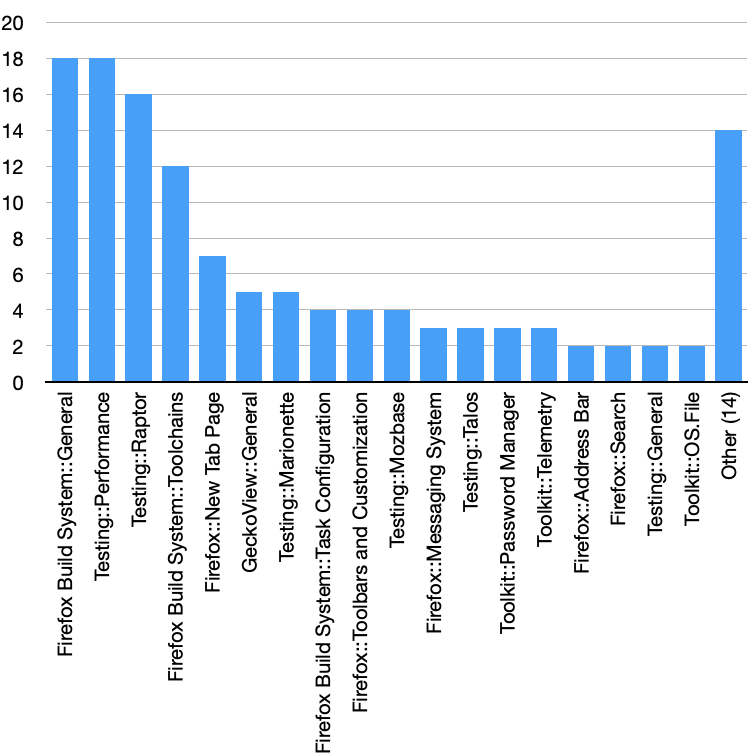
Similar to the previous chart, I’ve grouped products/components with just one regression bug into an “Other” category.
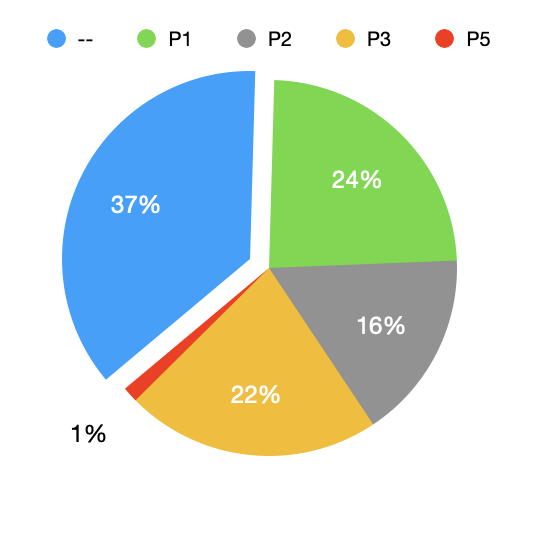
Priority
Finally, let’s take a look at the priority of the bugs. Although 37% have no priority set, all but one of these had an assignee, and most of them have been resolved.
Summary of alerts
Each month I’ll highlight the regressions and improvements found.
- 😍 7 bugs were associated with improvements
- 🤐 6 regressions were accepted
- 🤩 6 regressions were fixed (or backed out)
- 🤥 0 regressions were invalid
- 🤗 1 regression is assigned
- 😨 1 regression is still open
Note that whilst I usually allow one week to pass before generating the report, there are still alerts under investigation for the period covered in this article. This means that whilst I believe these metrics to be accurate at the time of writing, some of them may change over time.
I would love to hear your feedback on this article, the queries, the dashboard, or anything else related to performance sheriffing or performance testing. You can comment here, or find the team on Matrix in #perftest or #perfsheriffs.
The dashboard for January can be found here (for those with access).
No comments yet
Comments are closed, but trackbacks are open.