Originally, we used a Web Extension for doing performance testing on Firefox in our Raptor test harness. But, we needed to add new features such as visual metrics, so in this post, I’ll briefly describe the steps we took to migrate Raptor to Browsertime.
We now have enabled Browsertime by default in our Raptor harness both locally, and in Continuous Integration (CI) but for some time, we needed to use the flag `–browsertime` to enable it. This work started with Nick Alexander, Rob Wood, and Barret Rennie adding the flag in bug 1566171. From there, others on the Performance team (myself included), began testing Browsertime, preparing the Raptor harness, and building up the infrastructure required for running Browsertime tests in CI.
Our primary motivation for all of this work was obtaining visual metrics. If you’ve never heard of visual metrics before, they can be summed up as performance metrics processed from a video recording of a pageload. You can find more information about these from this article titled Improving Firefox Page Load, by Bas Schouten. Initially, our visual metrics processing system used a two-machine system where one machine would run the test and the other would process the video recordings to obtain the metrics. This worked well for some time until we found some issues with it that were a large point of friction when it came to using our tooling. In Reworking our Visual Metrics Processing System, I describe these issues and how we overcame them. It suffices to say that we now use a single machine in CI, and that those issues were resolved.
After building an MVP, we needed to answer the question: can we catch as many, or more regressions with Browsertime? This is important to answer as we don’t want to swap engines and then find out that we catch less regressions than we did before. There are a couple ways of finding an answer to this and one of the most obvious is back-testing on all previous valid performance alerts to see if Browsertime also sees the changes. But this is unfeasible because it would be extremely time-consuming to go through all of the alerts we have. Instead, we ran our existing pageload tests using Browsertime in CI and then performed a statistical comparison of the changes to the data profile versus the web-extension.
We primarily made use of Levene’s test to compare the two which looked at how the variance differed. We didn’t care about changes to the mean/average of the results because changing the underlying engine that we use was bound to make our metrics change in some way. We only analyzed our high-impact tests here, or those that often had valid performance alerts, and found that in most cases the changes were acceptable on all 4 platforms (Linux, OSX, Windows, Android). At the same time, we saw improvements in most of our warm pageloads because we started using a new testing mode called “chimera” which ran 1 cold (first navigation), and 1 warm pageload (second navigation) for each browser session on each test page. We decided that the benefits of having visual metrics outweighed the risks of removing the web-extension which were few and mainly related to some increases in variance.
With the analysis complete and successful, we began migrating our platforms one at a time and only migrating our pageload tests to start with. After that, we worked through all of our additional tests such as benchmarks, and resource-usage tests. This was a slow process as we didn’t want to overload sheriffs with new performance alerts, and it allowed us to resolve issues that we found along the way. Throughout this time, we worked with Peter Hedenskog on improving Browsertime, and implementing new features there for Firefox. Each migration took approximately 2 weeks from the time we enabled the Browsertime tests to the time we disabled the web-extension tests.
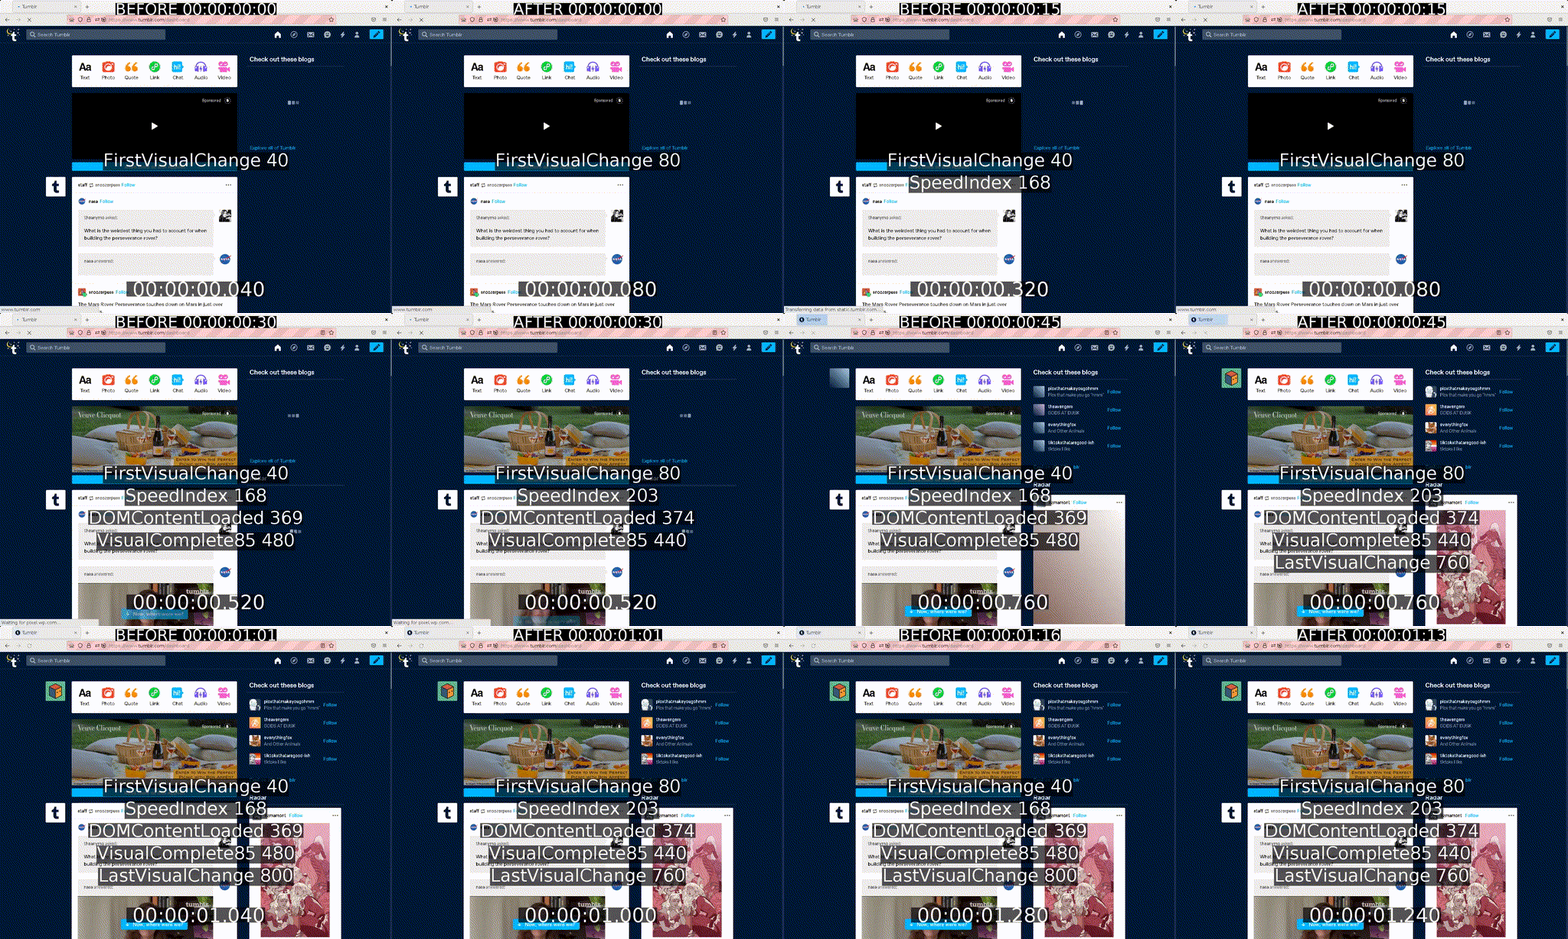
Now, we’ve made it to a point where nearly all of our tests are running on Browsertime! The only remaining tests are power, and memory usage tests as we had no easy way to measure these in Browsertime until recently, in the next few months these should be removed and all of our web-extension code will be also. We’ve made great use of Browsertime for other forms of testing as well now because using a Geckodriver-based engine allows for much more customizable testing versus the web-extension. Furthermore, we’ve started building up our tools for processing these videos which you can find in our mozperftest-tools repository. We use these to make it easier to understand how/why some performance metrics changed in a given test, and some work is ongoing to make it easier for developers to use these tools. For instance, we can make GIFs that make it easy to spot the differences:

Before/After Video of a Tumblr Pageload
Thanks to the whole Performance team for all the effort put into this migration and Peter Hedenskog, creator of Browsertime and Sitespeed.io, for all the help!


No comments yet
Comments are closed, but trackbacks are open.