Perfherder is one of the primary tools used by our performance sheriffs to triage and investigate regression (and improvement) alerts. It’s also a key part of the workflow any Firefox engineer may experience when working on performance, either responding to a regression, or proactively measuring the impact of their changes. This post will cover the various improvements that have been made to Perfherder so far in 2020.
Server-side search for alerts
Prior to this change, searching within the alerts view was entirely client-side. This had some strange effects on the pagination, which would mean sheriffs would waste time clicking through many blank pages of alerts when filtering by alerts assigned to them for example.
Retrigger jobs from compare view
Last year we introduced a popular feature request with the ability to retrigger jobs from the compare view. Earlier this year we’ve enhanced this further by allowing the user to specify how many retriggers should be requested for the base and new revisions.
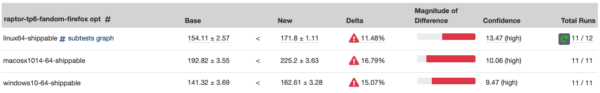
The retrigger button is shown in the compare view when you hover near the total runs when you’re logged in
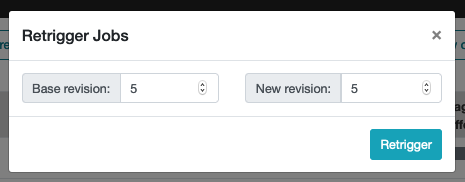
The retrigger will by default request 5 jobs against both the base and new revisions
Distinguishing results by application
As we move towards clearer test names, many of the latest performance tests do not include the target application name in the test names. This means they were difficult to distinguish in Perfherder. There’s still some work to do here, but you can now see the application displayed in the graphs legend alongside the repository and platform.
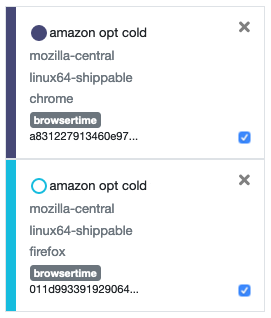
Legend showing results for the same test against both Firefox and Google Chrome
Adding tags to alert summaries
For a while now the performance sheriffs have been using the notes feature of alert summaries as a way to add tags. Examples include #regression-backedout and #regression-fixed, which can add context for improvements, and also provides valuable insights into our alert data. To improve our consistency applying these, we’ve moved them from the notes to a dedicated tagging feature. Sheriffs can now apply predefined tags, which are then displayed prominently in the alert summary.
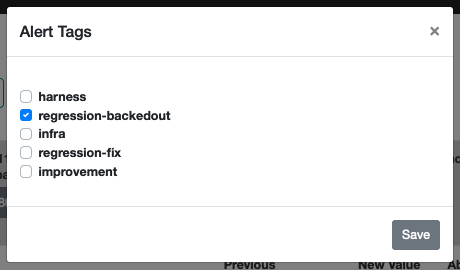
Tags are selected from a predefined list
UI/UX improvements
There were also several smaller improvements to the UI/UX that shouldn’t go unmentioned:
- If you provide a name for your comparison view, this is now reflected in the page title so you can easily find it again in your open tabs and browser history.
- Regression bug templates have been simplified, and updated to take advantage of Markdown formatting.
- Graphs now show the measurement units along the y-axis when provided by the test results.
- Most commonly used repositories are grouped for convenience when populating graphs.
- Added “all statuses” and “all frameworks” to filters in alerts view.
- Provided first/last page shortcuts in alerts view pagination.
- Removed mozilla-inbound from graphs view links from alerts.
- Removed AWFY framework due to these tests being migrated to Raptor.
Bug fixes
The following bug fixes are also worth highlighting:
- When selecting tests to populate graphs, the list of tests is now refreshed whenever any of the filters are updated.
- We no longer show links in the graph datapoint tool-tip when the associated job has expired.
Acknowledgements
These updates would not have been possible without Ionuț Goldan, Alexandru Irimovici, Alexandru Ionescu, Andra Esanu, and Florin Strugariu. Thanks also to the Treeherder team for reviewing patches and supporting these contributions to the project. Finally, thank you to all of the Firefox engineers for all of your bug reports and feedback on Perfherder and the performance workflow. Keep it coming, and we look forward to sharing more updates with you all soon.
No comments yet
Comments are closed, but trackbacks are open.