In September there were 153 alerts generated, resulting in 25 regression bugs being filed on average 7.8 days after the regressing change landed.
Every time code is pushed to autoland there is a chance that performance tests such as benchmarks and page loads will be run. The results from these tests are ingested by Perfherder (the performance oriented sibling to Treeherder). If a significant and sustained change (either a regression or an improvement) is detected in the results for any test, an alert will be generated. Performance sheriffs monitor these alerts, identify the push that caused it, and notify the patch author of the change, who then helps to determine the best course of action. This helps us to catch and prevent regressions from reaching our users, and also provides valuable feedback on our efforts to improve performance and to celebrate these wins.
For a little over a year I have been sending a newsletter to several groups within Mozilla with various metrics related to our regression detection and sheriffing efficiency. Each month I have improved and added to the report, often in response to feedback received. Looking back, my first report from July 2019 included just 5 visualisations, whereas my most recent report from August 2020 included 23. As a result of this growth, the report has become rather dense and overwhelming, and so I’m trying something new. Instead of sending a snapshot of the report by email each month, I’m going to publish an article on our performance blog with a short summary and highlight a few of the findings. For those with access, the full dashboard will be available on Mozilla’s redash instance.
Sheriffing efficiency
In this first edition of the new format, I’m going to focus on the metrics that demonstrate the efficiency of our sheriffing workflow. We currently have two sheriffs spending up to 50% of their time on monitoring alerts (both regressions and improvements), with the remainder of their time spent working on performance test engineering. An overview of the sheriffing workflow can be found on our wiki. We have a number of targets related to sheriffing, which I’ll highlight below.
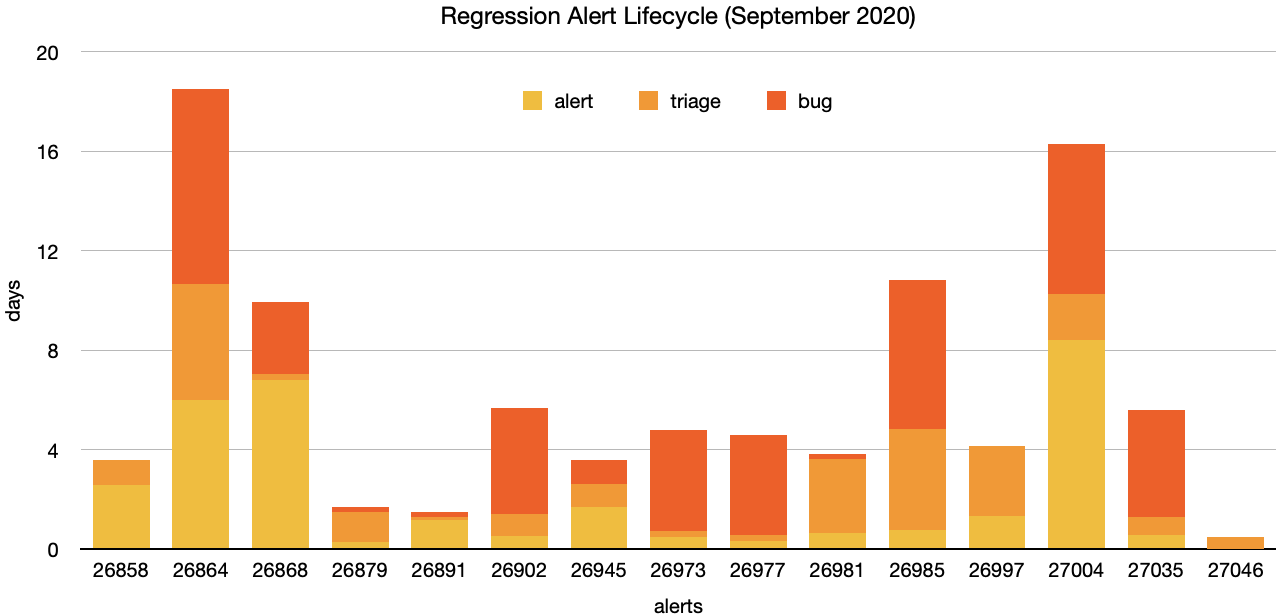
This chart shows the duration each regression alert (excluding manually created alerts) spent in each phase of the lifecycle. From the push to the alert, then to triage, and finally to the regression bug. To view any of these alerts in Perfherder visit https://treeherder.mozilla.org/perf.html#/alerts?id=26858 replacing the id as needed.
Triage response
We have a target to respond to all alerts within 3 days of them being generated. When alerts are created, they are in a state of ‘untriaged’ and they remain in this state until a sheriff takes ownership of the alert and modified the state. In September, our sheriffs triaged alerts in an average of 1.5 days, and 81% of alerts were triaged within 3 days. It is possible for sheriffs to manually create alerts, either as part of their investigation or if a change is noticed in the results that did not trigger an alert. As these manual alerts will be triaged immediately, they are excluded from these metrics.
Regression bug response
Once triaged, any valid regression alerts will result in either a new regression bug being filed or associating the alert to an existing bug. Our sheriffs have a target of associating all valid regression alerts with a bug within 5 days. As with the triage metrics, we exclude alerts created manually by the sheriffs. In September, our sheriffs associated valid regression alerts with bugs in an average of 4.2 days, and 67% of valid regression alerts were associated with a bug within 5 days.
Regression feedback response
Related to the above metrics is the time between a commit that causes a regression landing, and the resulting regression bug being filed. This depends on more than the efficiency of the performance sheriffs as it also covers the time until the alert being generated. We have a target of 8 days for this metric, and as mentioned in the opening for this article we averaged 7.8 days in September, with 74% of regression feedback provided within 8 days.
Summary of alerts
Each month I’ll highlight the regressions and improvements found.
- 😍 18 bugs were associated with improvements
- 🤐 11 regressions were accepted
- 🤩 10 regressions were fixed (or backed out)
- 🤥 2 regressions were invalid
- 😨 2 regressions are still open
Note that whilst I usually allow one week to pass before generating the report, there are still alerts under investigation for the period covered in this article. This means that whilst I believe these metrics to be accurate at the time of writing, some of them may change over time.
I would love to hear your feedback on this article, the queries, the dashboard, or anything else related to performance sheriffing or performance testing. You can comment here, or find the team on Matrix in #perftest or #perfsheriffs.
The dashboard for September can be found here (for those with access).
No comments yet
Comments are closed, but trackbacks are open.