In June there were 119 alerts generated, resulting in 22 regression bugs being filed on average 3.7 days after the regressing change landed.
Welcome to the June 2021 edition of the performance sheriffing newsletter. Here you’ll find the usual summary of our sheriffing efficiency metrics, followed by an update on automated backfills for regressions. If you’re interested (and if you have access) you can view the full dashboard.
Sheriffing efficiency
- All alerts were triaged in an average of 1.2 days
- 87% of alerts were triaged within 3 days
- Valid regressions were associated with bugs in an average of 1.3 days
- 100% of valid regressions were associated with bugs within 5 days
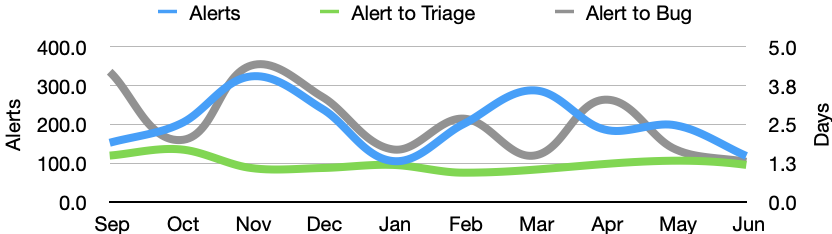
As mentioned in last month’s newsletter, automated backfills were enabled in April and we had already seen some early signs that this had a positive impact on the time it takes for our sheriffs to raise regression bugs. I’m encouraged to see that this trend has continued into June’s results, and both May and June had 100% of regression bugs raised within 5 days. It is worth noting that the total number of alerts also dropped in June, so it may still be too early to draw any conclusions.
Highlights from H1/2021
Now that we’re over halfway through the year, it’s a perfect time to reflect on the highlights in performance testing so far in 2021.
Visual page load on Desktop
In 2019 we started to add support in our performance tests for using the popular performance tool Browsertime, with a view to eventually replace our internally developed web extension. Back in February we completed the migration for all of the performance tests that we actively sheriff (we have a handful of tests still using the web extension).
Integrating Browsertime provides us with valuable visual metrics (much closer to user perceived performance than the navigation timing metrics). It also gives us improved browser support by using WebDriver instead of a web extension (web extensions are not supported on Chrome for Android). You can read more about this work in last month’s newsletter.
Automated backfills
In April we enabled automatic backfills for alerts for Linux and Windows. This means that whenever we generate an alert summary for these platforms, we now automatically trigger the affected tests against additional pushes. This is typically the first thing a sheriff will do when triaging an alert, and whilst it isn’t a time consuming task, the triggered jobs can take a while to run. By automating this, we increase the chance of our sheriffs having the additional context needed to identify the push that caused the alert at the time of triage.
If successful, automatic backfills should reduce the time between the alert being generated and the regression bug being opened. If you’re interested in following the progress, the sheriffing efficiency is shared each month in this newsletter.
Record/replay sites in mozperftest
In the last few weeks, the team has integrated mozperftest with mozproxy. To better understand this integration, and why it was necessary we first need to provide context for each of these tools.
- The mozperftest project was created with the intention to replace all existing performance testing frameworks that exist in the mozilla-central source tree with a single one, and make performance tests a standardised, 1st class citizen, alongside mochitests and xpcshell tests.
- The mozproxy tool allows you to launch an HTTP proxy to either record all the requests/responses when visiting a website, or to use one of these recordings to simulate visiting a website. This is currently used in Raptor to run our page load tests, eliminating network latency, and preventing deployments of service disruptions to these sites from affecting our results.
As mozperftest is already able to run tests using browsertime (like our Raptor harness), the last step remaining to introduce the ability to run our page load tests in mozperftest was integrating the proxy service. This work also simplifies the process of generating recordings, and will allow us to move closer to automating many of these.
PerfDocs improvements
Back in November, Greg Mierzwinski posted about Dynamic Test Documentation with PerfDocs. Since then, development has continued, and I’d like to highlight a few recent improvements. The first is that we now display a more compact view for tests, with details by default concealed from view. We also provide convenient links for when you need to direct anyone to the documentation for a specific test, in which case we also automatically expand to show the full details. These links are also now used in various places where test data is shown, such as bugzilla, Perfherder, and https://arewefastyet.com/.
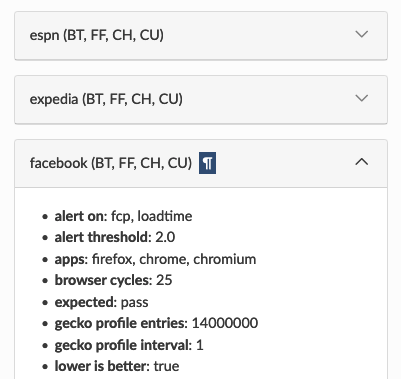
PerfDocs example with test details expanded
In addition to this, we have integrated PerfDocs generation with our TaskCluster scheduling. This means that we’re able to quickly answer the question of which platforms and branches tests are running. An awesome side-effect of this integration is that any change to the scheduling of performance tests will cause the PerfDocs to be updated, and the performance test team will be automatically flagged as reviewers for the patch. This will significantly reduce the risk of unintentionally running (or not running) performance tests on certain platforms. Check out the PerfDocs for the Facebook desktop page load test for an example of this by looking for the Test Task section.
You can visit PerfDocs for our other harnesses by visiting the Performance Testing page. At this time Talos and AWSY are static pages, and were recently migrated from the Mozilla Wiki. Raptor and mozperftest are dynamically generated from the test definitions.
I’d like to highlight that most of the work on PerfDocs has been thanks to Myeongjun Go [:myeongjun], our fantastic volunteer contributor!
Perfherder improvements
There have been a lot of improvements to Perfherder, which is used to visualise performance data and manage alerts when regressions are detected. See What’s new in Perfherder? for details of the latest updates, including many from this year.
Summary of alerts
Each month I’ll highlight the regressions and improvements found.
- 😍 5 bugs were associated with improvements
- 🤐 7 regressions were accepted
- 🤩 3 regressions were fixed (or backed out)
- 🤥 0 regressions were invalid
- 🤗 0 regressions are assigned
- 😨 7 regressions are unassigned
- 😵 0 regressions were reopened
Note that whilst I usually allow one week to pass before generating the report, there are still alerts under investigation for the period covered in this article. This means that whilst I believe these metrics to be accurate at the time of writing, some of them may change over time.
I would love to hear your feedback on this article, the queries, the dashboard, or anything else related to performance sheriffing or performance testing. You can comment here, or find the team on Matrix in #perftest or #perfsheriffs.
The dashboard for June can be found here (for those with access).
No comments yet
Comments are closed, but trackbacks are open.