In October there were 303 alerts generated, resulting in 45 regression bugs being filed on average 5.2 days after the regressing change landed.
Welcome to the October 2021 edition of the performance sheriffing newsletter. Here you’ll find the usual summary of our sheriffing efficiency metrics. If you’re interested (and if you have access) you can view the full dashboard.
Sheriffing efficiency
- All alerts were triaged in an average of 2 days
- 71% of alerts were triaged within 3 days
- Valid regressions were associated with bugs in an average of 3 days
- 79% of valid regressions were associated with bugs within 5 days
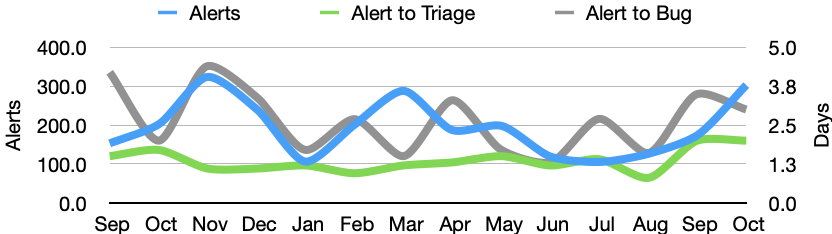
We had a huge increase in alerts during October, which was primarily due to changes in our tooling. Whenever we re-record our page load tests we need to review and accept a new baseline. Last month we made improvements to how we measure warm page load, and this resulted in an increase in alerts. We’ll likely see this again as we migrate to the latest version of mitmproxy (our server replay tool).
Summary of alerts
Each month we’ll highlight the regressions and improvements found.
- 😍 12 bugs were associated with improvements
- 🤐 18 regressions were accepted
- 🤩 10 regressions were fixed (or backed out)
- 🤥 0 regressions were invalid
- 🤗 2 regressions are assigned
- 😨 1 regression is unassigned
- 😵 1 regression was reopened
Note that whilst we usually allow one week to pass before generating the report, there are still alerts under investigation for the period covered in this article. This means that whilst we believe these metrics to be accurate at the time of writing, some of them may change over time.
We would love to hear your feedback on this article, the queries, the dashboard, or anything else related to performance sheriffing or performance testing. You can comment here, or find the team on Matrix in #perftest or #perfsheriffs.
The dashboard for October can be found here (for those with access).
No comments yet
Comments are closed, but trackbacks are open.