Firefox Profiler is a tool for analyzing the performance of both websites and Firefox itself. You can visit profiler.firefox.com to learn more about and enable it.
Inside the Firefox codebase, we have different profiler APIs to instrument the source code. With these APIs, threads can be registered with the profiler, different parts of the code can be annotated, and even more information (payload) can be included to a specific event inside the codebase, like a render or reflow event.
Inside the mozilla-central codebase, we have various programming languages like C++, JavaScript, Java and Rust. Since the profiler is implemented in C++, we have the most advanced API for that in C++. You can check its documentation out. Also, we’ve already had APIs for JavaScript, and Java for some time. But we didn’t have any canonical API for the Rust codebases. We had some hacks around bigger Rust projects like Servo or Webrender to register threads and add annotations, but they weren’t shared across different projects. Therefore we had a lot of code duplications in the different parts of the Firefox codebase. Also, it was pretty tiring work if you wanted to instrument your own Rust code with the profiler API because you had to write things from scratch.
To solve this issue, we wanted to work on a new Rust API that every Rust project inside mozilla-central can use without the need of implementing everything from scratch and having to maintain that code. Instead, the Firefox Profiler team would own the API crate and maintain it, so other people wouldn’t need to worry about it and they would simply import the API crate to their projects to use it. And this work has been completed in the last quarter! In this blog post, I will be talking about this API and some of the implementation details. You can also see the documentation of this API here. So let’s get into the details of this API and how to use it first.
The new gecko-profiler crate to the rescue!
For this work, we’ve created a new Rust crate called gecko-profiler inside the mozilla-central repository. This crate includes everything you need about the profiler, and you only need to import it to instrument your source code. It’s pretty simple to add a new crate to your source code. Go to your Cargo.toml file and add the new gecko-profiler dependency like this:
[dependencies]
gecko-profiler = { path = "../../tools/profiler/rust-api" }
After this addition, you need to update the Cargo.lock file by running cargo update -p gkrust-shared. And this is it, now you can start using the functions inside this crate.
To summarize the functionalities inside this crate, you can:
- Register the threads with the profiler, so the profiler can record these threads and you can see them in the profiler analysis UI.
- Add stack frame labels to annotate and add categories to a part of the stack.
- Add markers to mark an instant time or a duration of time during the code execution. With markers, you can also add more information as a payload to make it appear in the profiler analysis UI.
You can also check the profiler state to see if the profiler is running or not, but that’s something you usually do before adding a marker, so you don’t do unnecessary computations outside of a profiling session, but we’ll get into that later.
Let’s learn a bit more about how to use these functionalities with some examples.
Registering threads
Before profiling a thread, it must be registered first. Otherwise, the profiler can’t find and profile it. So if you are adding a new thread to your codebase, it’s a good idea to register it with the profiler too while you are working on it.
We have two functions for registering and unregistering a thread which are gecko_profiler::register_thread and gecko_profiler::unregister_thread respectively. While registering it, it also accepts a &str as the thread name. Here’s an example with a thread:
let thread_name = "New Thread";
std::thread::Builder::new()
    .name(thread_name.into())
    .spawn(move || {
        gecko_profiler::register_thread(thread_name);
        // DO SOME WORK
        gecko_profiler::unregister_thread();
    })
    .unwrap();
As you can see here, when we are spawning a thread, we are calling the register_thread function with the thread name. And right before exiting a thread, we are calling the unregister_thread function.
It’s good to keep in mind that registering a thread doesn’t mean that you will see that thread immediately in the profile data. You still need to do something, which is adding the name of that thread to the “Threads” filter inside the about:profiling page. That input is a comma-separated list and you can simply add another thread after a comma. After doing this, you will be able to see the thread inside the captured profile data.
Now that we registered the new thread that we are going to profile, let’s see how we can annotate our source code, so you can see more details inside the profiler analysis view.
Adding Stack Frame Labels
Stack frame labels are useful for annotating some parts of the call stacks with a category. This category will be shown in the Firefox Profiler analysis view timeline and the bottom panels like “Call Tree” and “Flame Graph”.
For adding stack frame labels, we have gecko_profiler_label! macro. This macro will extend and mark the stack with the given category, starting from that call until the end of the scope. This essentially extends to an RAII object. Here are some examples:
// Marking the stack as "Layout" category, no subcategory provided.
gecko_profiler_label!(Layout);
// Marking the stack as "JavaScript" category and "Parsing" subcategory.
gecko_profiler_label!(JavaScript, Parsing);
We also have a syntactical sugar called gecko_profiler_fn_label. This is a proc-macro that can be put on top of the functions. It will automatically wrap the whole function scope with that category. Its usage is like this:
#[gecko_profiler_fn_label(DOM)]
fn foo(bar: u32) -> u32 {
bar
}
There are various categories and subcategories that can be annotated with this functionality. To see the whole list of the categories, please see the profiling_categories.yaml file. I also will be talking about this file when digging into implementation details. Now let’s check our last but pretty big functionality, profiler markers.
Adding markers
Markers are packets of arbitrary data that are added to a profile by the Firefox code, usually to indicate something important happening at a point in time, or during an interval of time. We can add different types of markers to our code. There are a few functions you can use per marker type like gecko_profiler::add_untyped_marker, gecko_profiler::add_text_marker and gecko_profiler::add_marker. add_untyped_marker is being used for adding a simple marker without any additional information. add_text_marker is being used for adding a marker with only additional “text” information. And lastly, add_marker is being used for adding a marker with different kinds of data and visualization types.
Here’s some examples:
// Record a simple marker with the category of Graphics, DisplayListBuilding.
gecko_profiler::add_untyped_marker(
    // Name of the marker as a string.
    "Marker Name",
    // Category with an optional sub-category.
    gecko_profiler_category!(Graphics, DisplayListBuilding),
    // MarkerOptions that keeps options like marker timing and marker stack.
    // It will be a point in type by default.
    Default::default(),
);
// Create a marker with some additional text information.
let info = "info about this marker";
gecko_profiler::add_text_marker(
    // Name of the marker as a string.
    "Marker Name",
    // Category with an optional sub-category.
    gecko_profiler_category!(DOM),
    // MarkerOptions that keeps options like marker timing and marker stack.
    MarkerOptions {
        timing: MarkerTiming::instant_now(),
        ..Default::default()
    },
    // Additional information as a string.
    info,
);
These examples show you how to add simple markers. To add more interesting markers with different data fields, add_marker function can be used. But since it’s a bit complicated, I won’t explain this in this blog post. You can refer to our Rust API documentation for more details of it.
We also have functions like gecko_profiler::is_active and gecko_profiler::can_accept_markers. They are pretty self explanatory. is_active can be used to check if the profiler is active. can_accept_markers can be used to know if the profiler is active and running and can accept markers. This function is especially useful when you want to add a marker but you need to compute some information to add inside the marker payload. You can put the computations inside a can_accept_markers if block so the code will not run when the profiler is not running.
Some implementation details if you are curious
We talked about the API itself. And you can always check the documentation of it here. I also wanted to talk about the implementation details and the challenges we faced when we were implementing this.
Profiling categories
I mentioned before that our profiler categories list lives inside the profiling_categories.yaml file. Before this work, it was hard coded inside a C++ file. But we couldn’t use the same C++ file inside the Rust side. We could use the rust-bindgen to create some bindings for it, but it wasn’t a clean solution, since we had to touch the Rust side every time we changed the categories. So instead, we chose to move the categories to a yaml file and generate both C++ header files and Rust files from that during the build time.
So now, we have a build step like this:
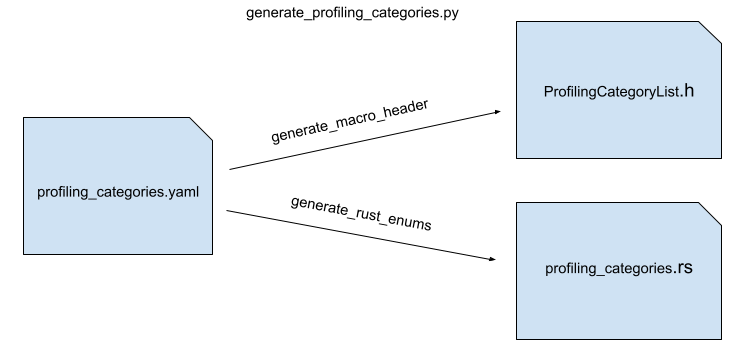
This generation step helped us generate better and more idiomatic Rust enums and also keep the C++ header as-is. Also, in the future, when someone needs to add a category, they won’t have to edit both sides. Only changing the yaml file should be enough. If you are curious about the generated files, please take a look at the C++ header file here and the Rust file here.
Using C++ objects inside Rust
We are using both rust-bindgen and cbindgen in our crate. rust-bindgen automatically generates the FFI bindings of C++ functions/enums/classes so we can access them inside Rust. cbindgen automatically generates the FFI bindings of Rust functions so we can access them inside C++. I would say that cbindgen usage is pretty small with two functions. But we are using the rust-bindgen extensively. And this caused a bit of a problem during the implementation phase.
The biggest problem was the usage of C++ structs and classes inside the Rust code. For advanced marker API, we had to use some of these classes inside of Rust code like the MarkerSchema class. Ideally, you should never create a C++ class inside the Rust code. You should always leave the lifetime of an object to its language. If it’s a C++ object, let C++ initialize it, and return the pointer to the Rust side so you can use it there. And vice versa. When you are destroying an object, it’s the same. You should give the pointer back to C++, so we can destroy the C++ object on the C++ side. This part was fine. When we needed a MarkerSchema object we were initializing an empty memory in Rust, then, we were calling a C++ FFI function and it was creating and returning the object back to Rust.
Here’s an example of this lifetime:
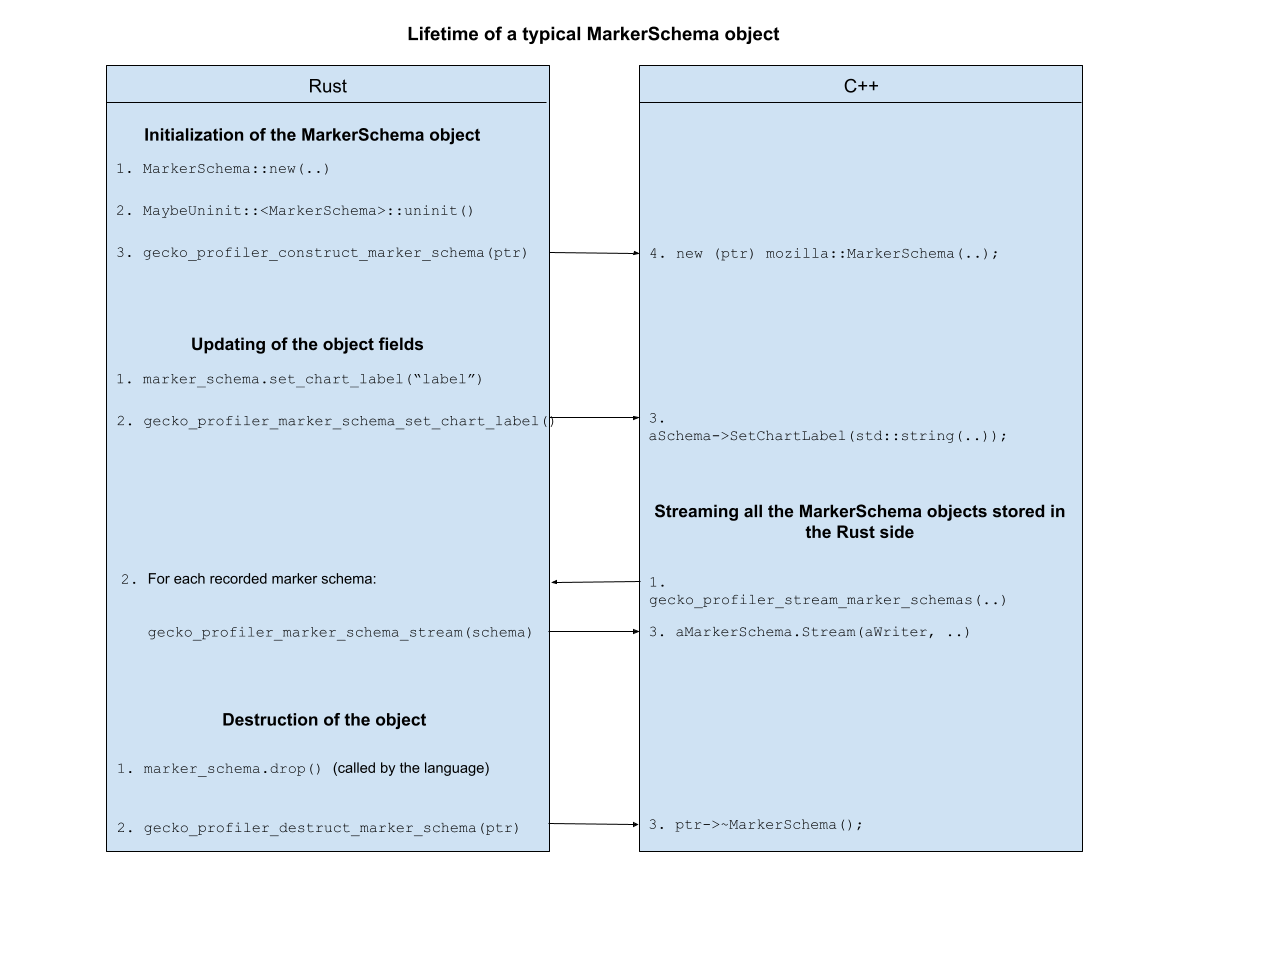 Now, things start to get interesting. Because we were creating the memory space on the Rust side, we had to know the size of that C++ object. And this is where rust-bindgen comes into play. It nicely generates a
 MarkerSchema struct on the Rust side with the same size as the C++ counterpart. With this generated struct you would know that sizeof(RustMarkerSchema) == sizeof(CPPMarkerSchema). Unfortunately, there is a caveat, rust-bindgen can generate the sizes of simple classes that don’t have complex fields perfectly. But it can’t generate some classes if the field of that object is complex or contains internal pointers. And, of course, the MarkerSchema class contains some std::string and std::vector fields and they both have internal pointers.
So instead of allocating the same size, we were actually allocating a smaller memory on the Rust side and sending that to C++ to construct the class instance. When we were doing it, some extra fields of that class were just being written into some junk memory address and there was no guarantee that it would not be overwritten. Luckily, we found this out with our address sanitizer jobs in the CI. In the end, the solution was simple, but it took multiple days of debugging and analyzing the problem to figure out and find a solution. I must say that rr and Pernosco were super helpful during this process. I could just record a session and replay it multiple times, even I could share that recording with my colleague Gerald Squelart so we could analyze it together. In the end, the fixing code was just two lines of rust-bindgen configuration.
Conclusion
I feel like there is a lot more to talk about this API for both usage-wise and implementation details-wise, but I don’t want to bore you too much with the details as well. This was definitely an interesting journey and I learned a lot while I was working on it! I would like to also thank two of my colleagues, Gerald Squelart and Emilio Cobos Álvarez. They helped me a lot during the implementation of this API and they helped with reviewing the work. Also, there are a lot more people I asked for their feedback about the API, thank you, everyone!
Please let us know if you have any questions or feedback. You can find us in the “Firefox Profiler” room on chat.mozilla.org.
No comments yet
Comments are closed, but trackbacks are open.