
Usually, in our articles, we talk about performance from the performance engineer’s perspective, but in this one, I want to take a step back and look at it from another perspective. Earlier this year, I talked to an engineer about including more debugging information in the bugs we are filing for regressions. Trying to make a context out of the discussion, I realized the performance sheriffing process is complex and that many of our engineers have limited knowledge of how we detect regressions, how we identify the patch that introduced it, and how to respond to a notification of a regression.
As a result, I decided to make a recording about how a Sheriff catches a regression and files the bug, and then how the engineer that wrote the source code causing the regression can get the information they need to resolve it. The video below has a simplified version of how the Performance Sheriffs open a performance regression.
In short, if there’s no test gap between the last good and the first regressed revision, a regression will be filed on the bug that caused it and linked to the alert.
Filing a regression – Demo
I caused a regression! Now what?
If you caused a regression then a sheriff will open a regression bug and set the regressor bug’s id to the regressed by field. In the regression description, you’ll find the tests regressed and you’ll be able to view a particular graph or the updated alert. Note: almost always the alert contains more items than the description. The video below will show you how to zoom in and find the regressing data point, see the job, trigger a profiler, and see the taskcluster task for it. There you’ll find the payload, dependencies, artifacts, or parsed log.
Investigating a regression – Demo
The full process of investigating an alert and finding the cause of a regression is much more complex than these examples. It has three phases before, and one after, which are: triaging the alerts, investigating the graphs, and filing the regression bug. The one after is following up and offering support to the author of the regressing bug to understand and/or fix the issue. These phases are illustrated below.
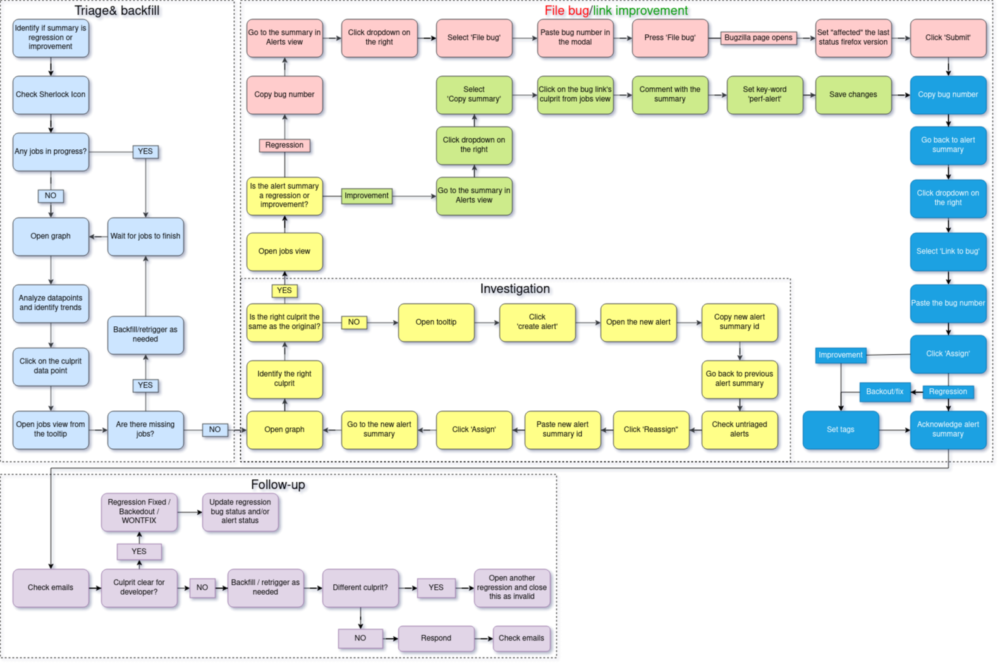
Sheriffing Workflow
Improvements
We have made several small improvements to the regression bug template that are worth noting:
- We added links to the ratio (magnitude) column that opens the graph of each alert item
- Previously the performance sheriffs set the severity of the regression, but we now allow the triage owners to determine severity based on the data provided
- We added a paragraph that lets you know you can trigger profiling jobs for the regressed tests before and after the commit, or ask the sheriff to do this for you.
- Added a cron job that will trigger performance tests for patches that are most likely to change the performance numbers
Work in progress
There are also three impactful projects in terms of performance:
- Integrating the side-by-side script to CI, the ultimate goal being to have side-by-side video comparisons generated automatically on regressions. Currently, there’s a local perftest-tools command that does the comparison.
- Having the profiler automatically triggered for the same purpose: having more investigation data available when a regression happens.
- Developing a more user-friendly performance comparison tool, PerfCompare, to replace Perfherder Compare View.
No comments yet
Comments are closed, but trackbacks are open.