If you’ve ever tried to figure out what performance tests you should run to target some component, and got lost in the nomenclature of our CI task names, then you’re not alone!
The current naming for performance tests that you’ll find when you run ./mach try fuzzy can look like this: test-android-hw-a51-11-0-aarch64-shippable-qr/opt-browsertime-tp6m-essential-geckoview-microsoft-support. The main reason why these task names are so convoluted is because we run so many different variant combinations of the same test across multiple platforms, and browsers. For those of us who are familiar with it, it’s not too complex. But for people who don’t see these daily, it can be overwhelming to try to figure out what tests they should be running, or even where to start in terms of asking questions. This leads to hesitancy in terms of taking the initiative to do performance testing themselves. In other words, our existing system is not fun, or intuitive to use which prevents people from taking performance into consideration in their day-to-day work.
Development
In May of 2022, the Performance team had a work week in Toronto, and we brainstormed how we could fix this issue. The original idea was to essentially to build a web-page, and/or improve the try chooser usage (you can find the bug for all of this ./mach try perf work here). However, given that developers were already used to the mach try fuzzy interface, it made little sense for us to build something new for developers to have to learn. So we decided to re-use the fzf interface from ./mach try fuzzy. I worked with Andrew Halberstadt [:ahal] to build an “alpha” set of changes first which had revealed two issues: (i) running hg through the Python subprocess module results in some interesting behaviours, and (ii) our perf selector changes had too much of an impact on the existing ./mach try fuzzy code. From there, I refactored the code for our fzf usage to make it easier to use in our perf selector, and so that we don’t impact existing tooling with our changes.
The hg issue we had was quite interesting. One feature of ./mach try perf is that it performs two pushes by default, one for your changes, and another for the base/parent of your patch without changes. We do this because comparisons with mozilla-central can sometimes result in people comparing apples to oranges due to minor differences in branch-specific setups. This double-push lets us produce a direct Perfherder (or PerfCompare) link in the console after running ./mach try perf to easily, and quickly know if a patch had any impact on the tests.
This was easier said than done! We needed to find a method that would allow us to both parse the logs, and print out these lines in real time so that the user could see there was something happening. At first, I tried the obvious method of parsing logs when I would trigger the push-to-try method but I quickly ran into all sorts of issues, like logs not being displayed and freezing. Digging into the push-to-try code in an effort to get hg logs parsed, I started off trying to run the script with the check_call, and run methods from the subprocess module. The check_call method caused hg to hang, and with the newer run method the logs were output far too slowly. It looked like the tool was frozen and this was a prime candidate for corrupting a repository. I ended up settling on using Popen because it gave us the best speed even though it was still slower than the original ./mach try fuzzy. I suspect that this issue stems from how hg protects the logging they do, and you can find a bit more info about that in this bug comment.
Outside of the issues I hit with log parsing, the core category building aspect of this tool went through a major rewrite one month after we landed the initial patches because of some unexpected issues. The issues were by design because we couldn’t tell exactly what combinations of variants could exist in Taskcluster. However, as Kash Shampur [:kshampur] rightly pointed out: “it’s disappointing to see so many tests available but none of them run any tests!”. I spent some time thinking about this issue and completely rewrote the core categorization code to use the current mechanism which involves building decision matrices whose dimensions are the suites, apps, platforms, variant combinations, and the categories (essentially, a 5-dimensional matrix). This made the code much simpler to read, and maintain because it allowed us to move any, and all specific/non-generalized code out of the core code. This problem was surprisingly well suited for matrix operations especially when we consider how apps, platforms, suites, and variants interact with each other and the categories. Instead of explicitly coding all of these combinations/restrictions into a method, we can put them into a matrix, and use OR/AND operations on matching elements (indices) across some dimensions to modify them. Using this matrix, we can figure out exactly which categories we should display to the user given their input by simply looking for all entries that are true/defined in the matrix.
Mach Try Perf

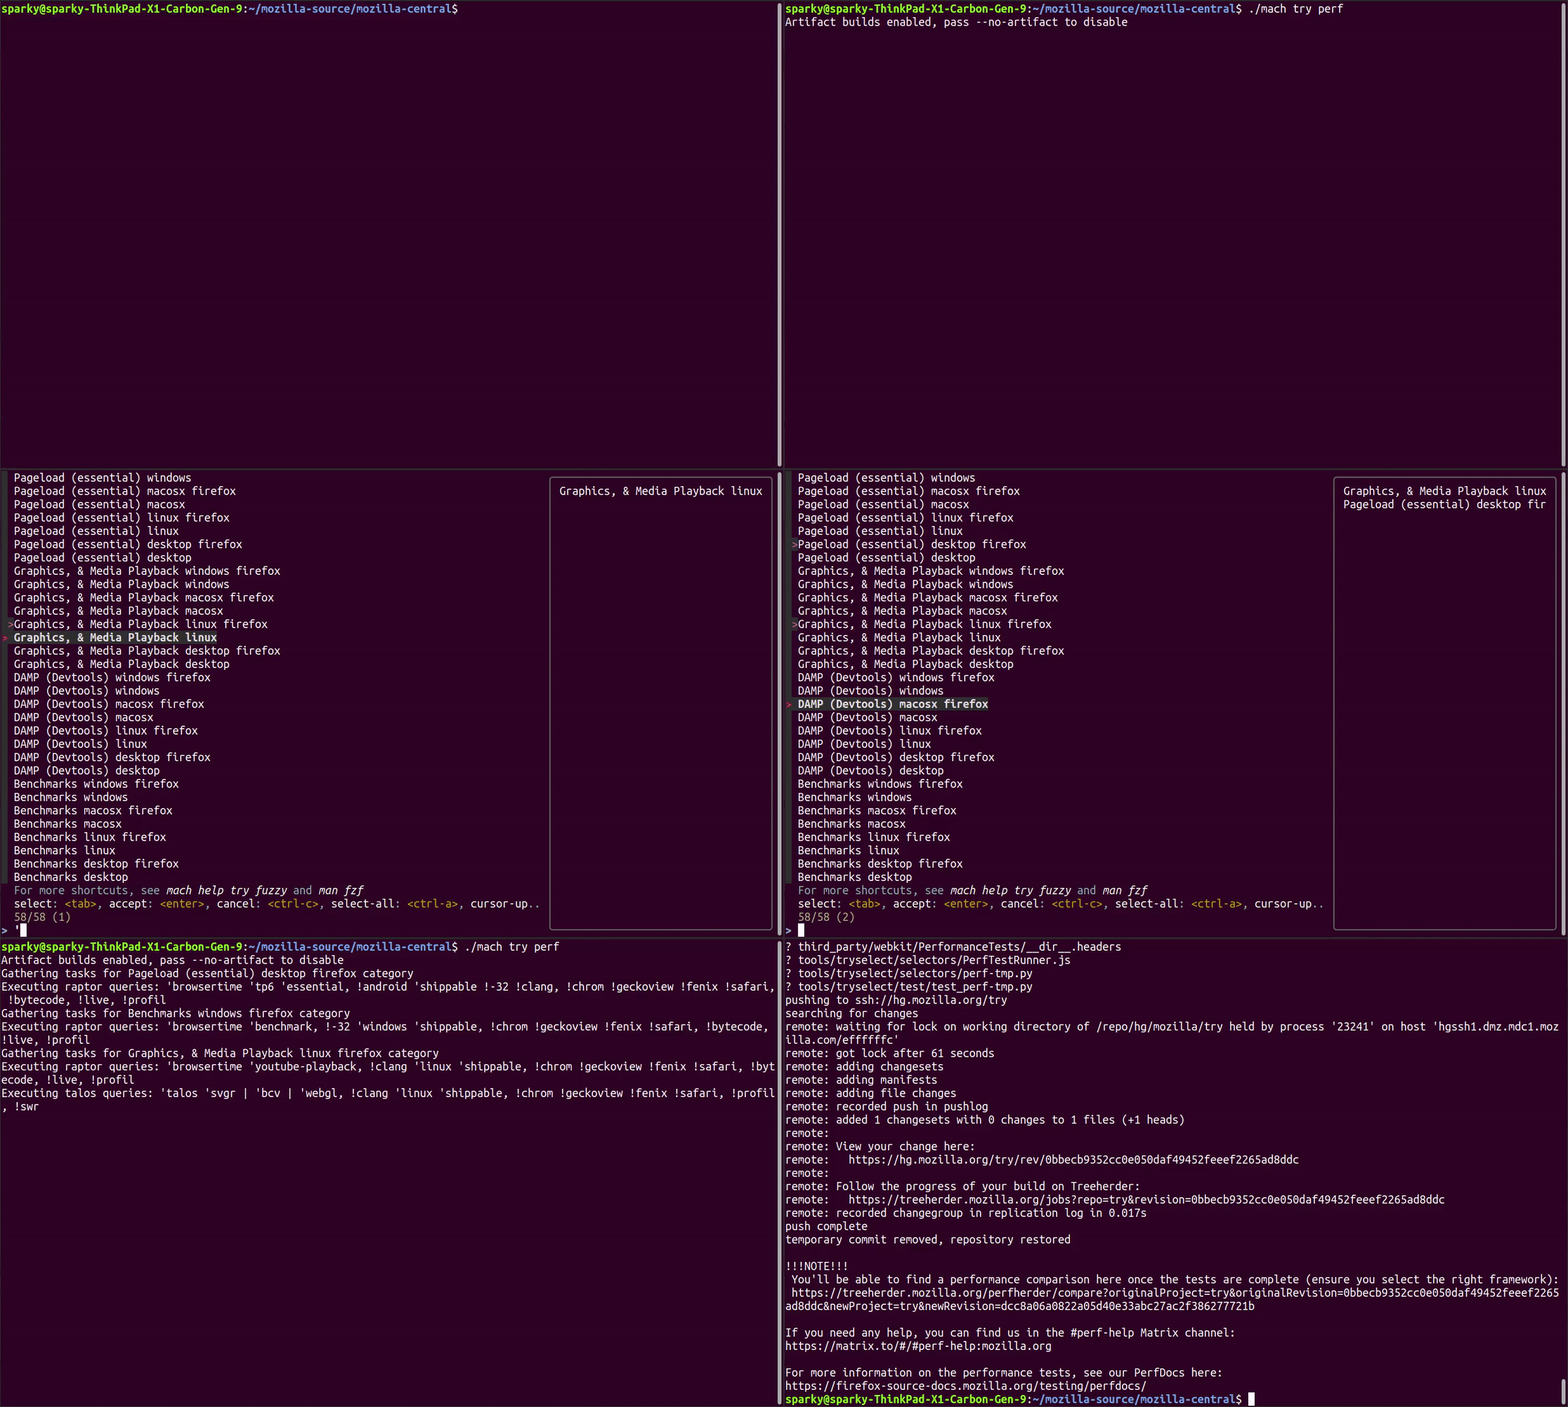
A (shortened) demo of the mach try perf tool.
The ./mach try perf tool was initially released as an “alpha” version in early November. After a major rewrite of the core code of the selector, and some testing, we’re making it more official, and widely known this month! From this point on, the recommended approach for doing performance testing in CI is to use this tool.
You can find all the information you need about this tool in our PerfDocs page for it here. It’s very simple to use; simply call ./mach try perf and it’ll bring up all the pre-built categories for you to select from. What each category is for should be very clear as they use simple names like Pageload for the pageload tests, or Benchmarks for benchmark tests. There are a number of categories there that are open for modifications/improvements, and you are free to add more if you want to!
If you are wondering where a particular test is use --no-push to output a list of the tasks selected from a particular selection (this will improve in the future). Checkout the --help for more options that you can use (for instance, Android, Chrome, and Safari tests are hidden behind a flag). The --show-all option is also very useful if the categories don’t contain the tests you want. It will let you select directly from the familiar ./mach try fuzzy interface using the full task graph.
Testimonials (or famous last words?) from people who have tested it out:
./mach try perf is really nice. I was so overusing that during the holiday season, but managed to land a rather major scheduling change without (at least currently) known perf regressions.– smaug
really enjoying ./mach try perf so far, great job– denispal
./mach try perf looks like exactly the kind of tool I was looking for!– asuth


No comments yet
Comments are closed, but trackbacks are open.