Since joining the Firefox Performance team as a Software Engineering Intern back in May, I’ve been working on improving performance profiles. Firefox developers need performance profiles that are readable, readily accessible, and automated. This makes it easier to identify performance regressions and bugs introduced by patches, as well as to diagnose and understand existing performance behavior. Let’s take a closer look at two notable improvements to our performance profiling pipelines that strive toward these goals:
Simpleperf Profiles for Firefox for Android Startup Tests (Bug 1969490)
With mobile performance being a major priority, we currently run Firefox for Android startup tests in CI with our mozperftest framework and use the Android CPU profiler Simpleperf to measure performance. However, the raw performance data produced by Simpleperf in these tests wasn’t human-readable. To address this, we added an automated pipeline in mozperftest that processes Simpleperf’s output into readable profiles that can be viewed in the Firefox Profiler.
To do this, we introduced two powerful toolchains to CI to process profiles: samply and Firefox Profiler’s symbolicator-cli.
samply is a cross-platform, Rust-based CPU profiler that, among other things, can convert performance data from profilers like Simpleperf to Firefox Profiler’s standard profile format and host a local symbol server for symbolication.
symbolicator-cli allows us to leverage Firefox Profiler’s backend and symbolicate the call stacks (i.e., resolve function addresses to their corresponding function names) from performance profiles using debug symbols hosted by samply.
This “toolchain approach” for symbolication is powerful. Updating our CI symbolication in-tree is as simple as bumping the Git revisions of the toolchains, allowing for easy updates to support the latest profile format version and rapid adoption of new Firefox Profiler features.
With these two toolchains, we updated mozperftest to be able to automatically produce symbolicated Simpleperf profiles when running tests. To use this feature with startup tests in CI, simply run:
./mach try fuzzy --full
and run any startup job suffixed with -profiling (e.g. perftest-android-hw-a55-aarch64-shippable-startup-fenix-newssite-applink-startup-profiling). The resulting Simpleperf profiles can immediately be inspected in the Firefox Profiler by clicking the “Open in Firefox Profiler” link next to the job’s profile artifact in Treeherder (below).
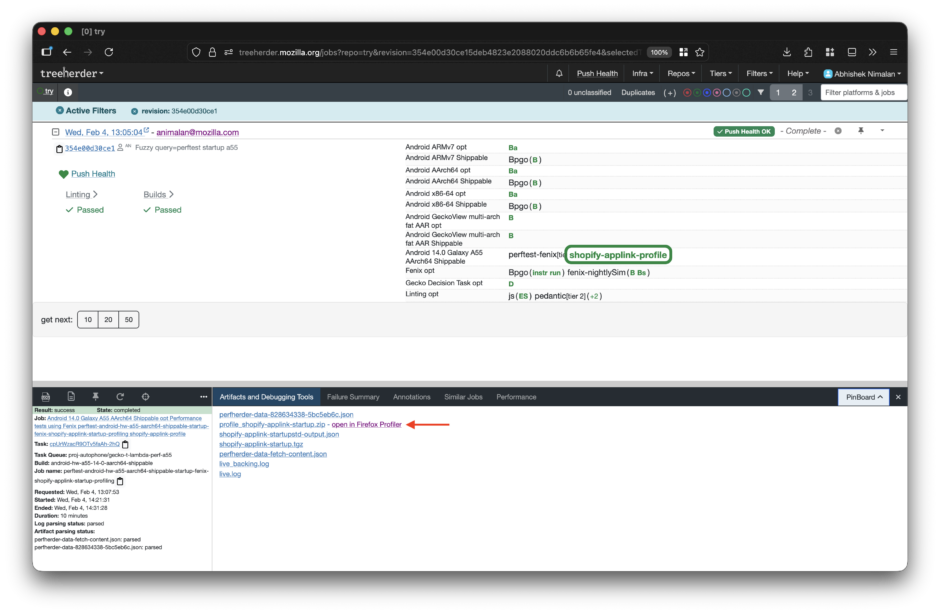
Viewing symbolicated Simpleperf profiles
Alternatively, you can select a mobile startup job in Treeherder and click the “Generate Performance Profile” button under the Performance tab to re-trigger the job with Simpleperf profiling.
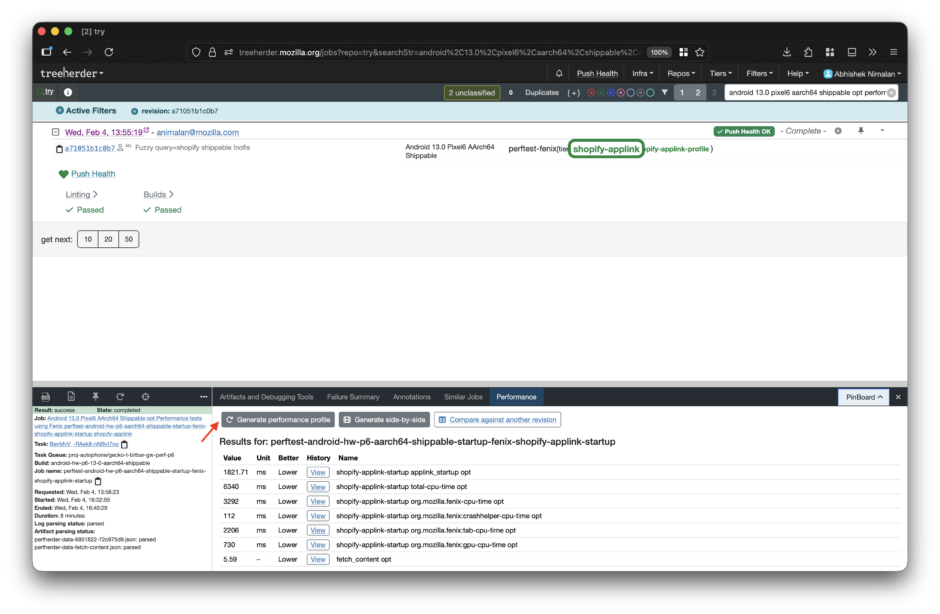
Generating symbolicated Simpleperf profiles
Better Symbolication for Test Harnesses (Bug 1970961)
Firefox’s test harnesses — Raptor, Talos, Mochitest, and XPCShell — all use the mozgeckoprofiler module to generate and symbolicate profiles in CI. This is done using --gecko-profile for Raptor/Talos tests or --profiler for XPCShell/Mochitest tests.
However, mozgeckoprofiler’s symbolication implementation was outdated and did not support newer features of the Firefox Profiler such as inline call stacks, source view, and assembly view — features that are useful for debugging and pinpointing regressions.
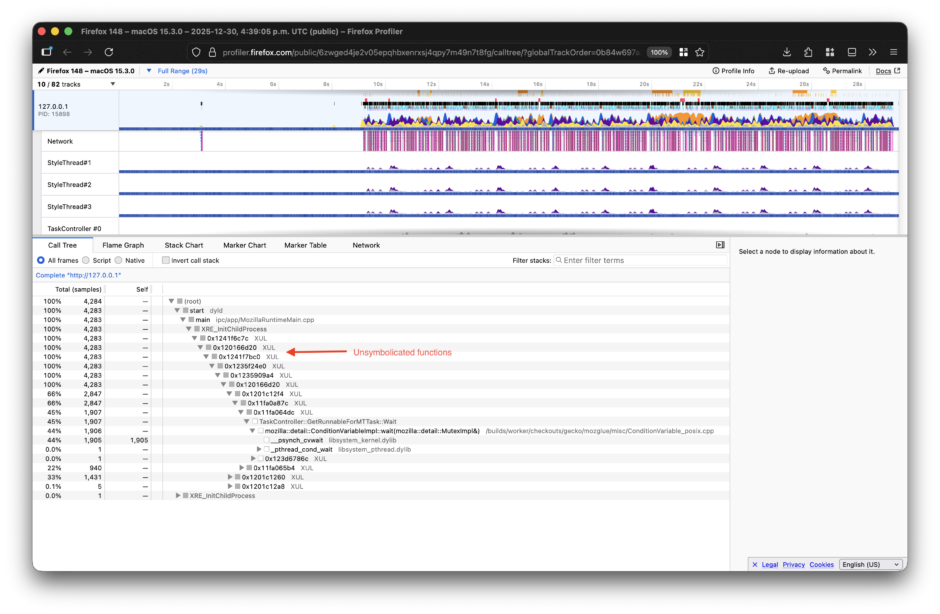
Profile with no symbolication
Profile with outdated symbolication (no inline function support or source view)
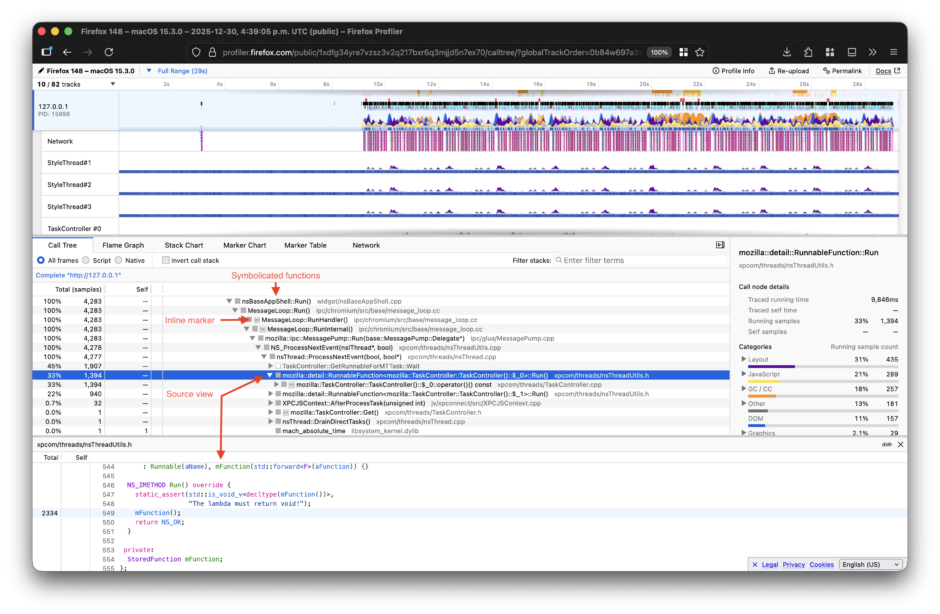
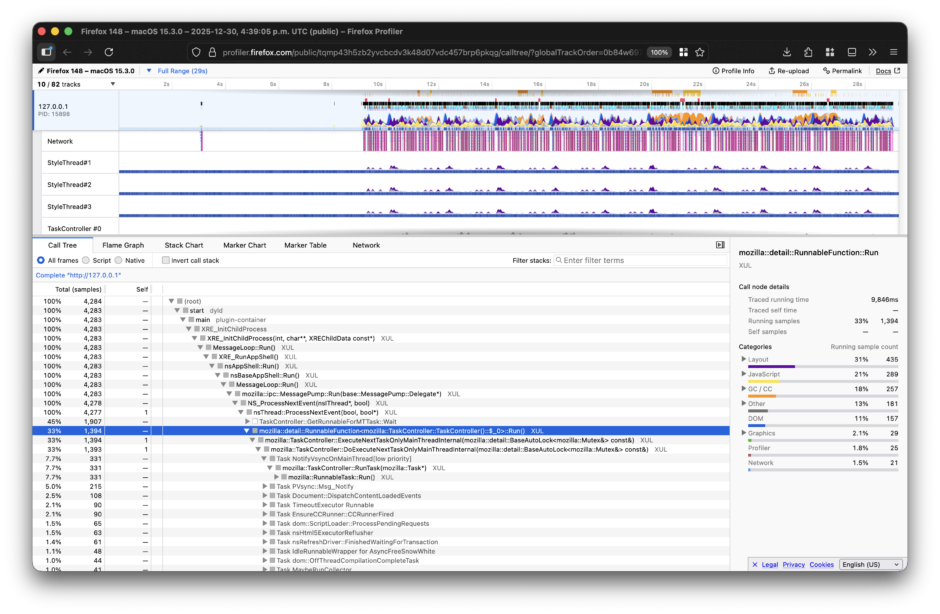
Profile with updated symbolication (support for inline functions and source view)
We have now updated this symbolication pipeline with the same toolchain approach used in mozperftest. This patch not only allows for richer profiles with mozgeckoprofiler but also paves the way for a more unified and maintainable approach to symbolication across our Firefox test platforms.
What’s Next?
These patches are part of an ongoing effort to make performance profiling easier, more standardized, and more useful for Firefox developers. Here are a few related bugs to keep an eye on:
- Bug 1978586: Raptor’s Speedometer 3 mobile tests can be more insightful if they provide performance profiles generated with Simpleperf. We should be able to leverage our mozgeckoprofiler patch for the symbolication step of this patch.
- Bug 2010311: Automatically generating reports that compare symbolicated profiles from patch changes with what’s in-tree would make it much easier for engineers to spot sources of performance regressions (layout, garbage collection, just-in-time compilation, etc.).
No comments yet
Comments are closed, but trackbacks are open.