In April there were 187 alerts generated, resulting in 34 regression bugs being filed on average 6 days after the regressing change landed.
Welcome to the April 2021 edition of the performance sheriffing newsletter. Here you’ll find the usual summary of our sheriffing efficiency metrics, followed by some analysis on our invalid regression alerts and bugs. If you’re interested (and if you have access) you can view the full dashboard.
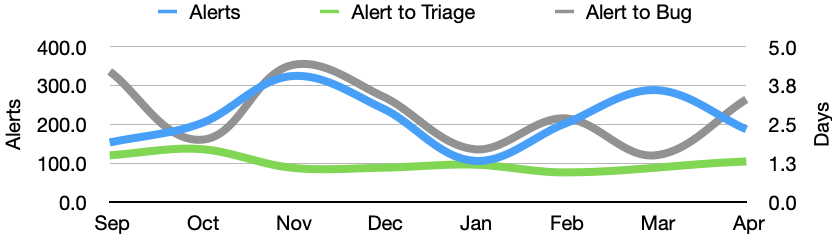
Sheriffing efficiency
- All alerts were triaged in an average of 1.3 days
- 85% of alerts were triaged within 3 days
- Valid regressions were associated with bugs in an average of 3.3 days
- 85% of valid regressions were associated with bugs within 5 days
Invalid Alerts
Sometimes we have alerts that turn out to be invalid. This usually means there were outliers in the results that triggered an alert, the results are multi-modal, or that the data is too noisy and the magnitude of the change is to small to confidently identify a culprit revision. Here’s an example of where outliers have caused invalid regression alerts:
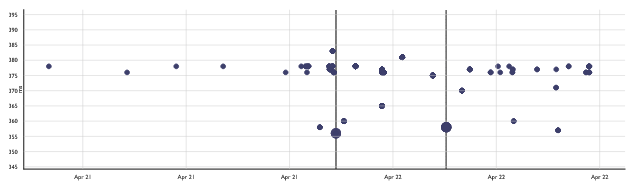
Perfherder graph showing invalid alerts due to outliers
These invalid alerts are usually identified by the performance sheriffs. They can be an indicator for the quality of our data and our change detection algorithm. If the percentage of invalid alerts increases we’ll be spending more time sheriffing these alerts, and we may want to investigate.
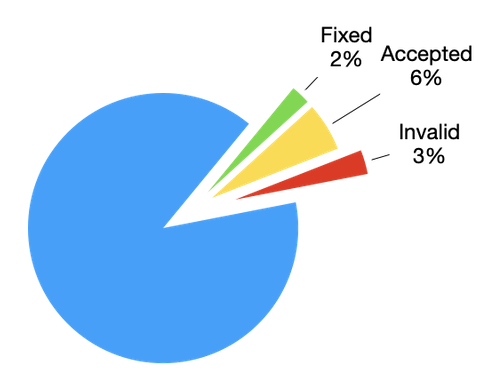
Regression Alerts by Status (April 2021)
In April we saw 5 invalid alerts, which equates for 3% of all regression alerts. Over the last 6 months we’ve seen 93 invalid alerts out 1,371 total alerts, just under 7%.
Invalid Regression Bugs
Occaisionally we detect a performance regression, identify the suspected culprit, and open a regression bug only for it to be closed as invalid. There can be a number of reasons for this, but the most likely is that the suspected culprit was incorrect. As our performance sheriffs are not expected to be familiar with all of our performance tests or what might impact them, we rely on the authors of suspected culprits to point out when the performance impact doesn’t make sense. When queried, our sheriffs will trigger additional tests around the regression range and either confirm the original culprit or close the bug as invalid and open a new one. Note that until recently, sheriffs may have used the same bug and simply modified the “regressed by” field. We have changed this to allow us to track the number of invalid bugs over time.
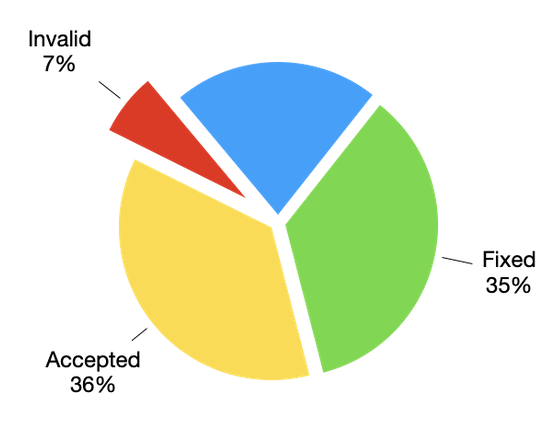
Regression Bugs by Status (April 2021)
Note that bugs may have many alerts, and are often resolved some time before the alerts, which explains why there are more open alerts than bugs. Our sheriffs periodically run a query to identify alerts linked to bugs that have been resolved and use this to sanity check and update the alerts as necessary.
Summary of alerts
Each month I’ll highlight the regressions and improvements found.
- 😍 9 bugs were associated with improvements
- 🤐 11 regressions were accepted
- 🤩 10 regressions were fixed (or backed out)
- 🤥 0 regressions were invalid
- 🤗 1 regression is assigned
- 😨 9 regressions are still open
- 😵 0 regressions were reopened
Note that whilst I usually allow one week to pass before generating the report, there are still alerts under investigation for the period covered in this article. This means that whilst I believe these metrics to be accurate at the time of writing, some of them may change over time.
I would love to hear your feedback on this article, the queries, the dashboard, or anything else related to performance sheriffing or performance testing. You can comment here, or find the team on Matrix in #perftest or #perfsheriffs.
The dashboard for April can be found here (for those with access).
No comments yet
Comments are closed, but trackbacks are open.