Introduction
Over the summer of 2018 we formed a new performance team at Mozilla. Our first objective was to better understand what performance means to our users.. We talked to many other teams at Mozilla, both technical and user-facing, gathered data about how Firefox compares to Chrome on a variety of metrics, and where user studies showed people indicating the biggest difference in experience between the browsers. After reviewing all the data, we picked one area of focus where we believed significant headway could be made. The area we picked, as you may have guessed from the title, was page load.
We define page load as the time between clicking a link, or pressing enter in the URL bar, to the time that a page is displayed in the browser and ready to be used.
Since then we’ve come a long way, and in this blogpost we will highlight some of the things we’ve done, and how they’ve affected the user experience in a variety of ways.
Validating Importance
One thing we noticed was the differences between Firefox and Chrome when the ‘load event’ fired on common webpages. At the time, this was one of the only real metrics we had on page load performance, and it did not look good for us! Although there was large differences between sites, overall Firefox was showing to be approximately 20% slower than Chrome. We worked with the Strategies & Insights team to validate that page load performance was important to user satisfaction. Our studies showed:
- Perceived performance was tightly correlated to user satisfaction
- Slow page load is one of the main reasonspeople uninstall Firefox
The data confirmed that we had a significant deficit for a metric our users care about. We set an aggressive goal to bring our page load performance to within 20% of Chrome on a platform-specific top list of sites on Desktop & GeckoView in 2019.
Defining Success using Visual Metrics
To make our page load times more competitive it was important to understand how we compared to Chrome in practice from a user experience point of view. Although there was a performance deficit, actual performance as perceived by the user wasn’t as dramatic as the 2-3x differences we observed in when the load event fired. We needed to measure additional metrics that were more representative of the visual user experience.
Our first investigation in this area used HDMI capture hardware to capture visual data, ensuring we had no external factors affecting performance. While accurate, this setup did not scale well and was not easily automatable. Since screen recorders running locally incurred a significant performance penalty we also introduced a smart, internal, low-overhead recording API for window contents into Firefox, allowing us to more easily capture visual data in an automated environment.
Once we had a method of collecting frames drawn during the page load process, we were able to analyze them and attempt to construct a metric that is representative of the perceived user experience on a page load. We started with an out of the box metric introduced by WebPageTest called SpeedIndex. However, content and layout of pages sometimes led to misleading SpeedIndex results. We ended up using three variations of SpeedIndex:
- SpeedIndex – This uses histogram based completion, essentially this means the page load’s completion is defined by how similar a frame is in color distribution to the final frame.
- PerceptualSpeedIndex – This uses SSIM, essentially this means the page load’s completion is defined by how structurally similar a frame is to the final frame of the page load. We found this metric to be more representative of page load progression for pages that consist of a large portion of empty space with a solid colour and in detecting layout jank.
- ContentfulSpeedIndex – This was developed in-house to supplement the other two in order to overcome some of their shortcomings. This essentially defines completion in terms of how similar the amount of content is to the amount of content in the final frame.
It should be noted that each one of these metrics had their own shortcomings and limitations, especially in the face of things such as splash screens appearing towards the end of page load. However, using the three metrics in combination gave us a reasonable approximation for the user experience on a page load.
Improving Load Event Time
As mentioned in the previous section, we noticed that the load event was firing much later for Firefox than it was for Chrome. While this generally was not representative of a vastly worse page load experience, we set out to understand why and what other difference it was hiding that could affect the page load experience. The initial investigation rapidly pointed to JavaScript code which generally dominates the CPU cycles consumed during page load.
Intuitively we leapt to the conclusion that we must have some performance cliffs that cause our average JS execution to be significantly slower during page load than the execution in V8. On further investigation, we found that time spent in most execution blocks were similar, but our execution order was vastly different.
We determined that a large amount of ordering differences were the result of setTimeout calls, often with a timeout value of 0. It stands to reason that any content provider choosing to use such a setTimeout, intends this code to be run asynchronously, and doesn’t intend this code to be vital for the initial page load. Chrome appeared to often defer the execution of code executed in this manner to a point after the load event had fired and completed. Firefox however, chose to run these as close to the specified wallclock time as possible. In the case of 0, as soon as it returned to the event loop.
A relatively simple patch was constructed to implement similar behavior in Firefox. We will now defer a setTimeout until load has completed, there is an idle window during the page load process, or a certain amount of time has elapsed since load started. Although mileage may vary, this led to a large improvement on a number of important sites for ‘loadTime’. (Figure 1)
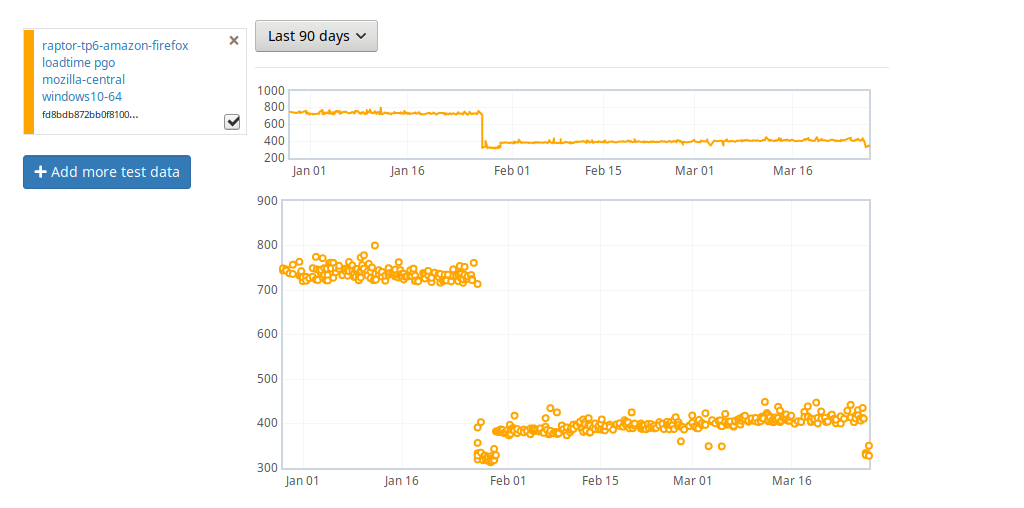
Figure 1 – Load times on Amazon
Other changes we made to make our ordering process more reliable and improve times for load event
One notable change is to delay firing XML HTTP Request (XHR) state change events during the page load process, preferrably until after page load. Many pages (for instance gmail) make use of extensive XHRs during page load and their state changes are very network dependent. Deferring those events improved both our loadtimes and boosted the signal to noise ratio in our tests.
Another was to move window.postMessage() handling onto the idle queue, several sites connect heavy event listeners to postMessage and we saw their page load performance improve considerably when not trying to run these while loading, for example Yahoo! News (Figure 2).
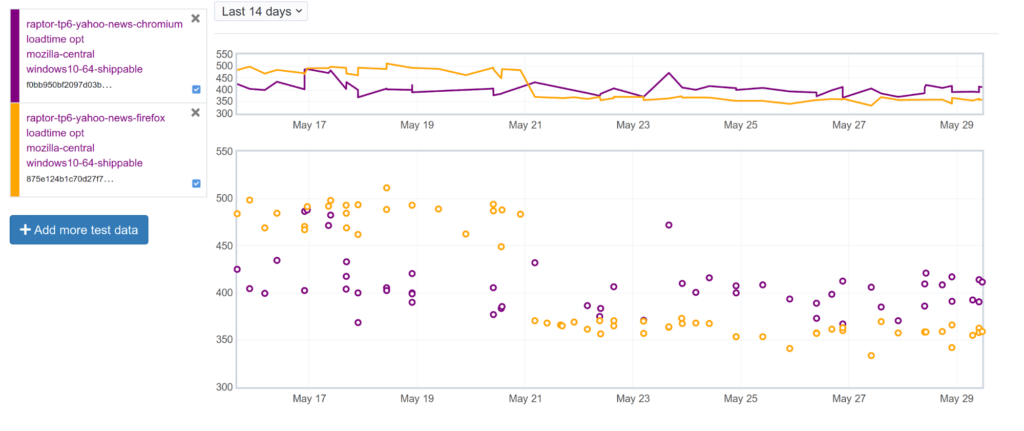
Figure 2 – Firefox vs Chrome loadTime performance on Yahoo! News
As promising as these results were though, in a lot of cases these improvements in our metrics did not lead to a significant improvement in perceived page load times, either in our visual metrics, or when confirmed visually by a human observer. However this did make our loadEvent timing and behavior much more comparable with Chrome, as well as confirmed the need for other measures of page load such as the visual metrics we had been working on.
Painting Sooner
Another difference we noticed that actually did affect perceived performance, was that Chrome was bringing its first paint to the screen earlier than Firefox. After analyzing profiles from these scenarios we determined that this was due to how we schedule paints during the page load process. Part of this means that our paint scheduling gets ‘spun up’ in a certain manner during page loads, by adjusting the way in which this is done we determined a significant improvement should be possible.
We decided to begin paint scheduling earlier in the page load process, thereby avoiding the ‘spin up’ latency to the first paint. In order to keep us from painting more than needed after the first contentful paint we moved subsequent paints to only occur when idle. Overall this made a significant difference on a set of sites in both our visual metrics and the first contentful paint (Figure 3). In addition to this the overpaint reduction can clearly be seen to improve load event completion on facebook (Figure 4).
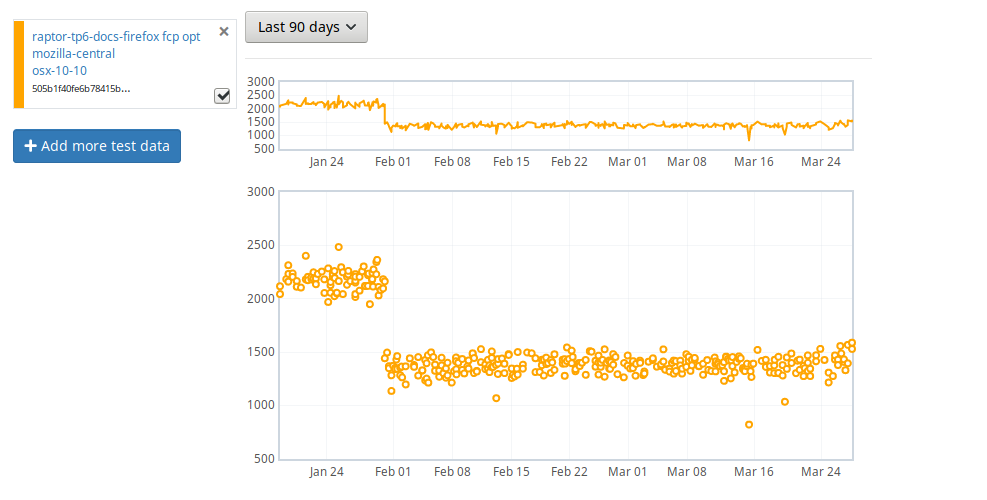
Figure 3 – Google Docs First Contentful Paint Times
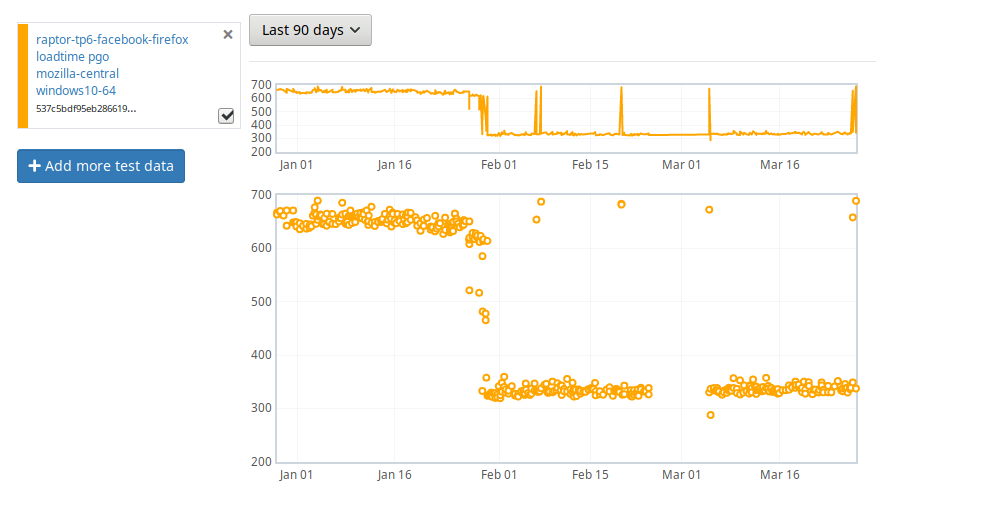
Figure 4 – Load Times on Facebook
Finally, on mobile devices we used to have a higher paint suppression time (the time that we delay painting for once a page starts loading) compared to desktop devices. After the improvements we made to the paint timing we adjusted the suppression time to be similar to desktop and we saw considerable improvements in our first paint performance across the board.
Delivering those Images
When visually analyzing page load recordings comparing the browsers, another difference we noticed was that images in Firefox frequently would appear later than on Chrome. We constructed a stand-alone test case that clearly demonstrated a large difference in when an image would be displayed under an unrealistically heavy javascript load.
Looking at profiles of what was going on in this situation we found the cause was rather interesting. Once the image is downloaded, we send it off to another thread to be decoded. After the decoding process is finished, this thread posts its result back to the main thread of the content process for it to be incorporated in the next paint. The main thread did not prioritize the incorporation of images in any way.
This means that if image delivery was delayed by JavaScript execution and a paint was scheduled with a high priority, that paint might simply be run without the decoded images, even though they are available for painting! The fix to this in the end was relatively simple: we now process decoded images with a higher priority. Telemetry from actual Firefox users shows us this clearly had an effect on how long it took decoded images to appear on the screen (Figure 5).
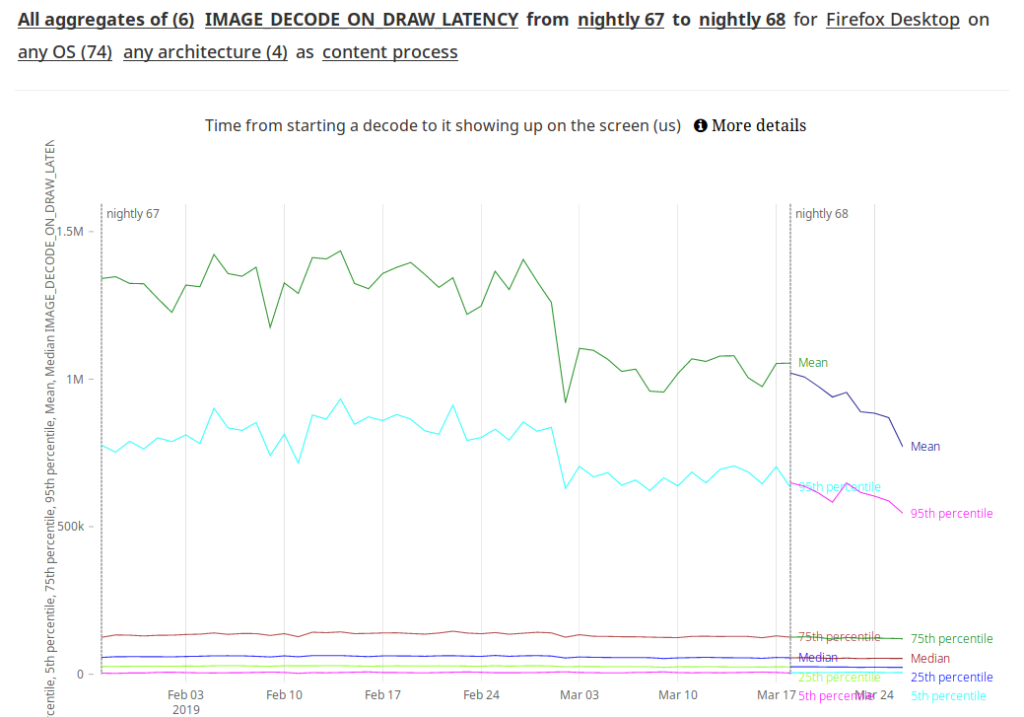
Figure 5 – Time for decoded images to appear on screen
Network Improvements
Another issue that we looked into was how the network stack performed during page load. We discovered a number of issues there, in many cases these were issues that could be addressed simply by adjusting certain values determined by the default preferences.
One thing that was a little more interesting was an issue where we found the storage of intermediate certificates was happening synchronously, and interfering with page load performance. We took steps to handle this work asynchronously and saw a big boost in performance, and again a reduction in noise (Figure 6).
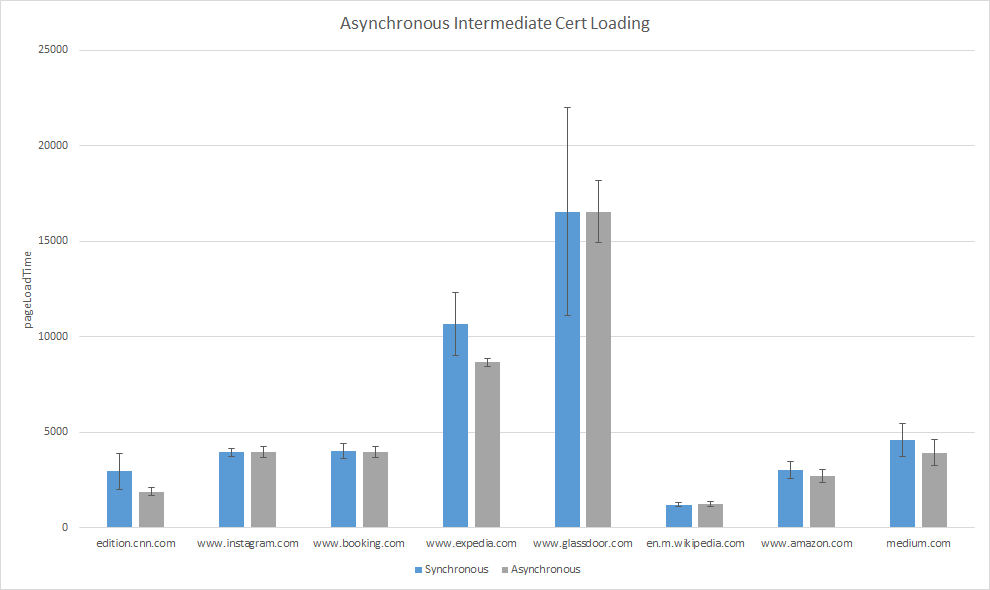
Figure 6 – Page loadTime using asynchronous intermediate cert storage
Another improvement related to network performance came from increasing the maximum entry size of the disk cache on Android. Historically, this had been set to a rather low value (4MB), raising it led to a considerable improvement on some sites, for example on Reddit (Figure 7).
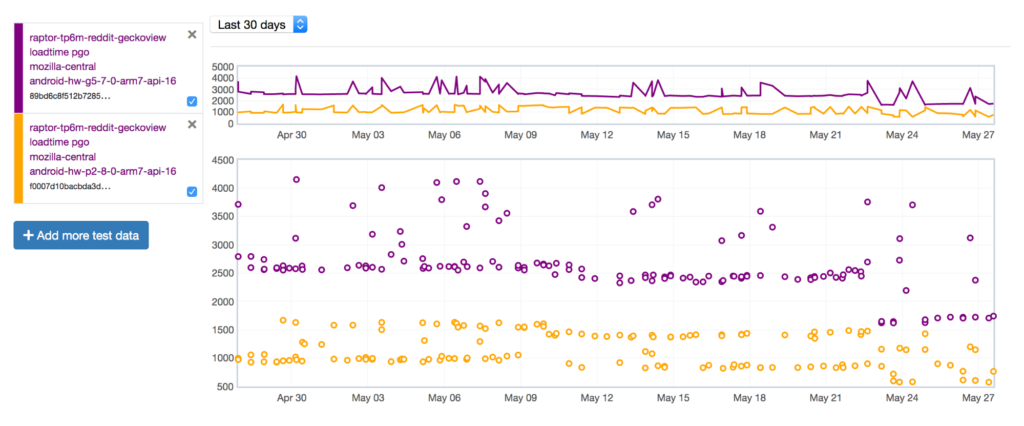
Figure 7 – loadTime improvements on Reddit after raising maximum cache entry size
A final issue with our network performance turned out to have been hiding in plain sight! While analyzing performance profiles of page loads on Android we discovered network requests were often being delayed for no obvious reason. In Gecko, we limit the maximum number of network connections that are active at any given time. Historically this had been set to a low value of 20 on Android, simply doubling this value led to considerable performance improvements on a wide range of sites (Figures 8 & 9).
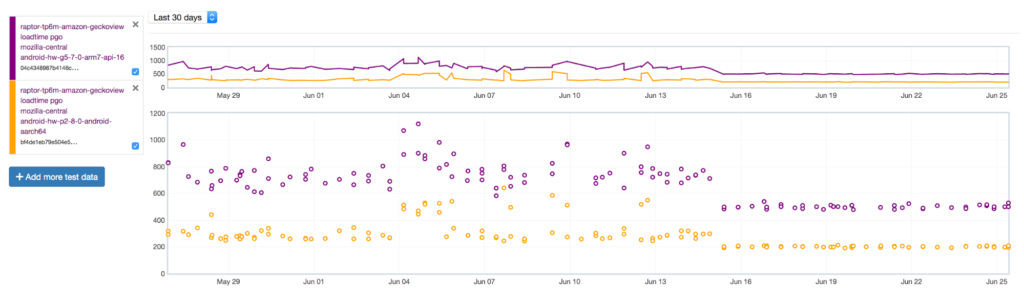
Figure 8 – loadTime improvements on Amazon following connection limit increase
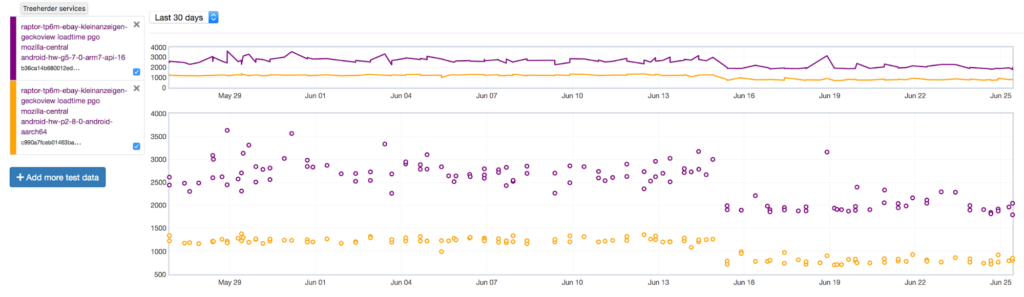
Figure 9 – loadTime improvements on eBay following connection limit increase
Conclusion
We started 2019 with a poor picture of page load in Firefox and an ambitious goal to bring our performance to within a comparable level with Chrome. By the end of 2019, not only did we achieve our goal to be within 20% of Chrome, we exceeded it by:
- Structurally analyzing a wide variety of sites
- Carefully targeting the page load experience
- Improving our ability to gather objective metrics that are directly representative of the user experience
We can now comfortably say that Firefox offers a page load performance which is on par with the competition. Many thanks to all the hard work of the members of the performance team, as well as many other people throughout Firefox who have supported us in our efforts, and joined in our focus!
No comments yet
Comments are closed, but trackbacks are open.