In February there were 201 alerts generated, resulting in 29 regression bugs being filed on average 4 days after the regressing change landed.
Welcome to the February 2021 edition of the performance sheriffing newsletter. Here you’ll find the usual summary of our sheriffing efficiency metrics, followed by some analysis on the data footprint of our performance metrics. If you’re interested (and if you have access) you can view the full dashboard.
Sheriffing efficiency
- All alerts were triaged in an average of 1 day
- 100% of alerts were triaged within 3 days
- Valid regressions were associated with bugs in an average of 2.7 days
- 88% of valid regressions were associated with bugs within 5 days
Now that we have six months of historical data on the sheriffing efficiency, I decided to add a second axis to see how the number of alerts correlates to the time it takes sheriffs to triage and raise regression bugs. As you can see there’s a close correlation.
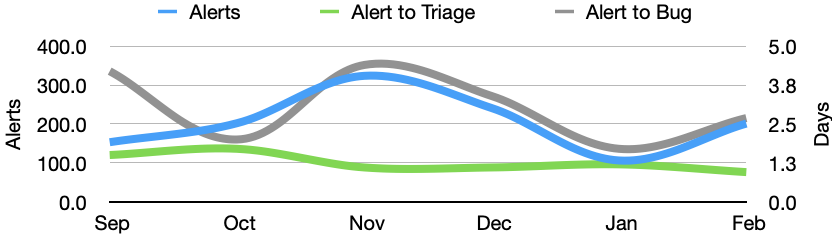
This highlights that any improvements to our regression detection or test coverage will likely overwhelm our sheriffing team and lead to delays with regressions being reported and resolved. As increasing the team of sheriffs is not a scalable solution, we’re investing in automating as much of the sheriffing workflow as possible. I look forward to providing updates on this as they develop, and for the time to regression bug correlating more closely with the time to triage than the number of alerts.
Data Footprint Analysis
Recently we’ve faced some issues with the storage capacity demands of Perfherder (our tool for ingesting, monitoring, and sheriffing performance data), and so we’ve been reviewing our data retention policies, and looking at other ways we can reduce our data footprint. Through a recent review of the performance data, we determined we could reduce our footprint by up to 17% by stopping ingestion of version control (vcs) metrics. This data is not monitored through Perfherder, so there’s no real need for us to store it.
In November’s newsletter, I covered the performance test frameworks that we monitor for regressions, but that doesn’t cover everything that we ingest. Here’s a chart showing the distribution of datapoints across all frameworks:
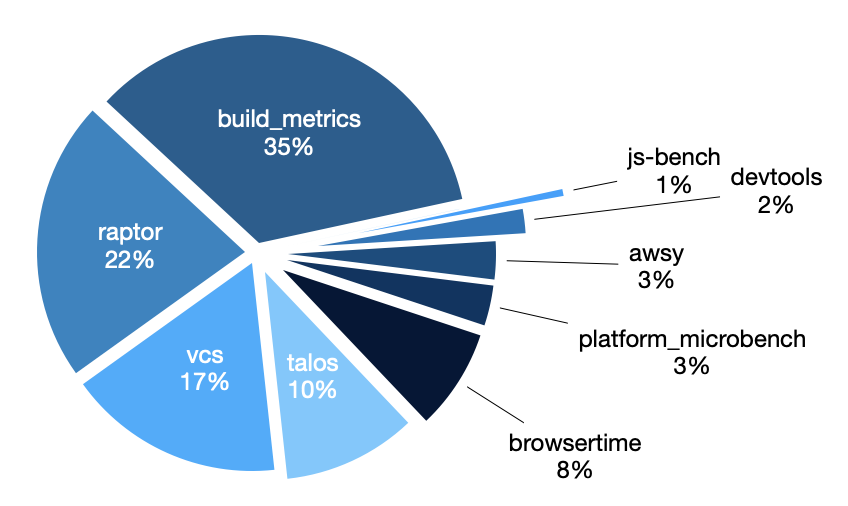
In addition to the sheriffed frameworks, we have:
- vcs – as covered above, this includes metrics covering the time taken to perform operations such as clone/update/pull on our version control system in CI. As this is not monitored within Perfherder we have stopped ingesting it.
- platform_microbench – these are graphics micro benchmarks introduced in bug 1256408 but never considered stable enough to monitor for regressions. As it’s been a while since we’ve looked at this data it’s worth reviewing to see if it can provide additional coverage.
- devtools – these are the performance tests for Firefox DevTools, which are monitored by the DevTools team.
If you’re interested in reading more about the vcs data that we’re no longer ingesting, it was introduced via bug 1448204 and Perfherder ingestion was disabled in bug 1692409.
Summary of alerts
Each month I’ll highlight the regressions and improvements found.
- 😍 7 bugs were associated with improvements
- 🤐 11 regressions were accepted
- 🤩 9 regressions were fixed (or backed out)
- 🤥 0 regressions were invalid
- 🤗 0 regressions are assigned
- 😨 11 regressions are still open
- 😵 3 regressions were reopened
Note that whilst I usually allow one week to pass before generating the report, there are still alerts under investigation for the period covered in this article. This means that whilst I believe these metrics to be accurate at the time of writing, some of them may change over time.
I would love to hear your feedback on this article, the queries, the dashboard, or anything else related to performance sheriffing or performance testing. You can comment here, or find the team on Matrix in #perftest or #perfsheriffs.
The dashboard for February can be found here (for those with access).
No comments yet
Comments are closed, but trackbacks are open.