
The Firefox Profiler and its overhead
Firefox includes its own profiler: Visit profiler.firefox.com to enable it, and the user documentation is available from there.
The main advantages compared with using a third-party profiler, are that it’s supplied with Firefox, it can capture screenshots, it understands JavaScript stacks, and Firefox is adding “markers” to indicate important events that may be useful to developers.
Its most visible function is to capture periodic “samples” of function call stacks from a number of threads in each process. Threads are selected during configuration in about:profiling, and can range from a handful of the most important threads, to all known threads.
This sampling is performed at regular intervals, by going through all selected threads and suspending each one temporarily while a sample of its current stack is captured (this is known as “stack walking”). This costly sampling operation can have a non-negligible impact on how the rest of the Firefox code runs, this is the “overhead” of the Profiler. In order to be able to sample as many threads as possible with the smallest impact, there is ongoing work to reduce this overhead.
Potential for optimization: Sleeping threads
One consideration is that most of the time, a large number of threads are not actually running, either because there is no work to be done (the user may not be interacting with Firefox), or because a thread may be waiting for the operating system to finish some long operation, like reading a file.
There are currently two ways to determine whether a thread can be considered “asleep”:
- In the Firefox code, there are instructions like
AUTO_PROFILER_THREAD_SLEEP, which indicate that a portion of code will be performing a small amount of work for an unknown duration that could stretch indefinitely. The most common situation is waiting for a condition variable to be signaled, for example when a task queue is waiting for a new task to be added, this addition may happen any time soon, or far into the future. - More recently, CPU utilization measurements were added to the Profiler. It is now possible to know if any activity happened since the previous sample; If it’s zero, we know for sure that the thread must be at the exact same spot as before, without needing to instrument the Firefox code.
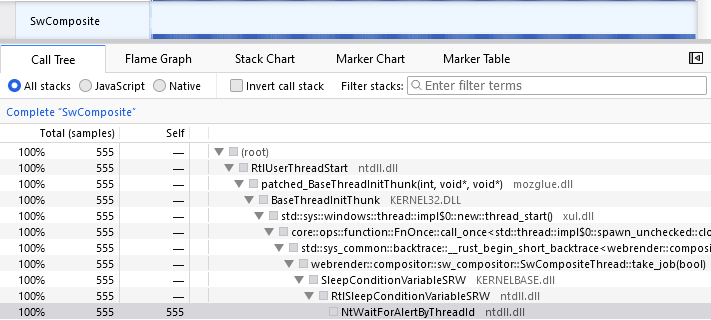
For example, in the following screenshot of a profile, the “SwComposite” thread spends all its time waiting for an event. All 555 stack samples are exactly the same. Notice that the CPU utilization graph (in the top blue row) is not visible because it’s at zero.
Original optimization: Copy the previous sample
Once we know that a thread is effectively idle, we only need to capture one sample representative of this period, and then this sample may be simply copied, as long as the thread stays asleep. This was implemented back in 2014.
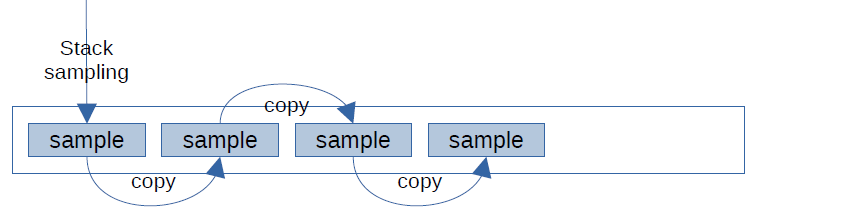
The important advantage here is that threads don’t need to be actively suspended and sampled, which takes much more time.
However, performing this copy still does take some time, and also the same space as before in the profile buffer.
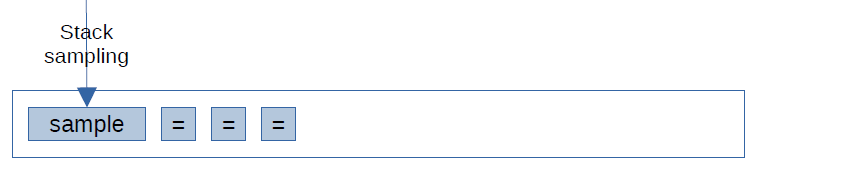
New optimization: Refer to the previous sample
Instead of copying a full stack, the profiler now uses a much smaller entry indicating that this sample is exactly the same as the previous one. As a rough estimate, stack traces take around 300 bytes on average. The new “same as before” entry takes less than 30 bytes, a 10 times improvement!
This may seem so obvious and simple, why wasn’t it done from the start, all those years ago?
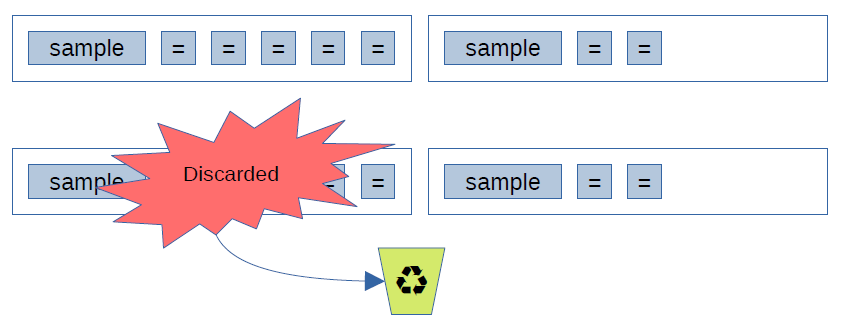
Problem: Old samples get discarded
The profiler only has a finite amount of memory available to store its data while profiling, otherwise it would eventually use up all of the computer’s memory if we let it run long enough! So after some time, the profiler starts to drop the oldest data, assuming that the last part of the profiling session is usually the most important to keep.
In this case, imagine that one thread stays asleep for the whole duration of the profiling session. Its stack was captured once at the beginning, but after that it was copied again and again. This worked because even if we dropped old samples, we would still have full (copied) samples in the buffer.

But now that we use a special entry that only says “same as before”, we run the risk that the initial full stack gets dropped, and at the end we wouldn’t be able to reconstruct the identical samples for that sleeping thread!

How can we ensure that we always keep samples for our sleeping threads?
Clue: Data is stored in chunks
An important detail of the profiler’s current implementation, is that instead of a traditional circular buffer, it uses “chunks” to store its data. A chunk is a memory buffer of a certain size, and we use a sequence of them to store the whole profile.
When a chunk becomes full, a new chunk is created and can store more data. After some time, the total size of all chunks in Firefox reaches a user-settable limit, at which point the oldest chunk is discarded — in practice it may be recycled for the next time a new chunk is needed, this removes some expensive memory allocation and de-allocation operations.
Thanks to this, we know that data is always removed chunk-by-chunk, so if one entry in a chunk refers to a previous entry in the same chunk, both entries are guaranteed to be present at the end, or both entries would have been discarded at the same time.
Solution: Keep at least one full sample per chunk
Finally, the solution to our problem becomes possible: Ensure that a full sample is always present in each chunk. How is that achieved, and why does it work?
During profiling, when the profiler is ready to store a “same as before” entry, it can check if the previous complete sample is in the same chunk, and if not, it will make a full copy of the stack from the previous chunk (there is a guarantee that the immediately-previous chunk cannot be discarded).
At the end of the profiling session, whichever chunk is first (the real first one, or the oldest one that still remains), it will always include a full sample, and the subsequent “same as before” entries will therefore have access to a full sample that can be copied.
Conclusion
In practice this optimization resulted in allowing around 50% more data to fit in profile buffers (because lots of samples now take a tiny space), and periodic sampling takes around 7 times less work than before (because we don’t need to find the old sample and copy it anymore).
This work was tracked in Bugzilla task 1633572, and landed on 2021-08-18 in Firefox 93, released on 2021-10-05. Thanks to my colleague Nazım Can Altınova for the code reviews.
It would theoretically be possible to further optimize sleeping thread sampling, but with diminishing returns. For example:
- During profiling, a copy of the last sample could be kept outside of the chunked buffer, and then when necessary (at the end of the profiling session, or if the thread stops sleeping) that outside sample could be copied into the buffer, so it would be available when outputting sleeping samples. However this feels like even more complex work, and the potential space gains (by not having a full sample in each chunk) would be relatively small.
- Instead of recording a “same as before” entry for each thread, we could skip all sleeping threads and only record one entry at the end of the sampling loop, meaning that any thread that didn’t get an explicit sample would be automatically considered asleep. This could give some useful savings when profiling many threads, because then it’s more likely that a large proportion would be asleep. This would probably be a fairly small space saving, but easy enough to implement that it could be worth it. To be continued!
If you have any questions, or would like to talk to the team, you can reach us in the “Firefox Profiler” room on chat.mozilla.org.
No comments yet
Comments are closed, but trackbacks are open.