As the Perf-Tools team, we are responsible for the Firefox Profiler. This newsletter gives an overview of the new features and improvements we’ve made in the third quarter of 2022.
You can find the previous newsletter here which was about the first half of 2022.
Here are some highlights.
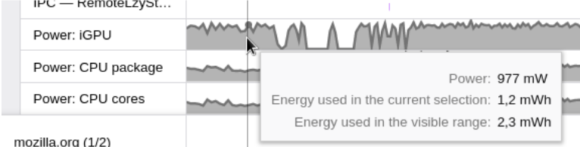
Power tracks on Windows 11 and Apple Silicon
Thanks to the new capabilities in Windows 11 and Apple Silicon, we can now capture the power use of Firefox while profiling. We gather this information into useful power tracks with tooltips showing both the instant power but also the energy in the current ranges:
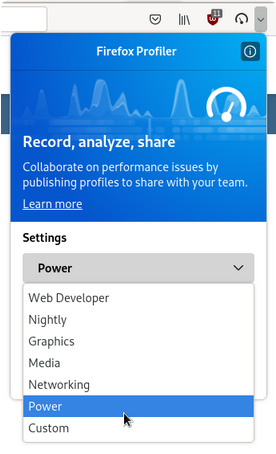
This can be enabled by using the preset Power from the profiler popup:
In October, the work continued to support this feature on Linux and Intel Macs.
Thanks Florian Quèze and Dan Robertson for working on this!
Improvements in the timeline
We’ve been busy improving the timeline (the top part of the profiler analysis UI) to make it easier to use when there are a lot of tracks.
- The threads are now sorted by name. Previously they were sorted by their start time. It’s now easier and more predictable to find one with a specific name among hundreds. Thanks, Paul Adenot!
- We can now select several threads using shift-click, and look at their merged data in the various panels.
- We finally removed the graph type radio buttons, by adopting good defaults depending on the profile data.
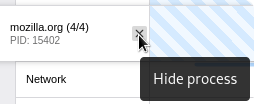
If you are a power user and would like to use another timeline graph type, you can call window.toggleTimelineType from the devtools console with various types. See the console message in profiler.firefox.com for more details. - We can more easily hide tracks by clicking the new X button:
Other changes and fixes
Improvements in the user interface
We also made some small usability changes in other parts of the interface, also with the help of a few contributors.
- In the Flame Graph, the roots are now alphabetically sorted. This makes it easier to look at changes between 2 captured profiles of the same application.
- The profile name could already be edited, but this wasn’t much discoverable. Our contributor Bhavya Joshi added a pen icon next to it, so that it’s now more visible. Thanks!
- We now hide panels that have no data. This happens for profiles captured with some specific configuration, or imported profiles.
- We now show the category breakdown of self time in the call tree sidebar. Thanks Johannes Bechberger!
Importers and non-visible changes
Some features and fixes related to importers were done, especially thanks to a few contributors:
- We fixed an issue where imported profiles from the Chrome format would have the same data in all tracks.
- The Chrome importer now uses a category Native instead of DOM. Thanks Khairul Azhar Kasmiran!
- Thanks to the work of Johannes Bechberger from SAP, profile importers got some more functionality:
- they can configure the UI better
- they can use the new list and table formats in their markers
And finally we achieved a few “under the hood” changes:
- We replaced our service worker implementation with a Workbox-based implementation, which finally allowed the migration to Webpack 5.
- We refactored the code responsible for capturing and generating the JSON data that allows us to not crash on an error like OOM (Bug 1612799).
- We reduced the URL length in most cases, which should reduce the occurrence of an error when generating a permalink.
- We improved the relationship between our performance tests and the profiler. Now after each browsertime runs, we’re automatically adding a last run with the profiler enabled, so that Firefox developers can debug problems right away:

- We support inline stacks for official builds now. Thanks to this important and massive work by Markus Stange (symbolic: #605, #607, #611, #622, #640, #641, #642, #648; dump_syms: #364, #392, #400, #407, #414, #415, #416, #417, #433, #445, #465; rust-minidump: #591, #598, #599, #602), we now have stacks that make better sense in these cases.
Contributors in Q3 2022
Lots of awesome people contributed to our codebases both on GitHub and mozilla-central in. We are thankful to all of them! Here’s a list of people who contributed to Firefox Profiler code:
- Amila Welihinda (amilajack)
- Bhavya Joshi (Bhavya0304)
- Florian Quèze (fqueze)
- Johannes Bechberger (parttimenerd)
- Julien Wajsberg (julienw)
- Khairul Azhar Kasmiran (kazarmy)
- Marc Leclair (MarcLeclair)
- Markus Stange (mstange)
- Nazım Can Altınova (canova)
- Paul Adenot (padenot)
We are also thankful of our localization team:
- Andreas Pettersson (sv-SE)
- Artem Polivanchuk (uk)
- Bund10z (es-CL)
- Fjoerfoks (fy-NL)
- Francesco Lodolo (it)
- Ian Neal (en-GB)
- Jim Spentzos (el)
- Luna Jernberg (sv-SE)
- Marcelo Ghelman (pt-BR)
- Mark Heijl (nl)
- Melo46 (ia)
- Michael Köhler (de)
- Pin-guang Chen (zh-TW)
- Théo Chevalier (fr)
- ZiriSut (kab)
- ravmn (es-CL)
- robovoice (de)
- wxie (zh-CN)
- Іhor Hordiichuk (uk)
- 你我皆凡人 (zh-CN)
Our translations happen on Pontoon, and you’re very welcome to contribute, either for an existing or for a new language.
Thanks a lot!
Conclusion
Thanks for reading! If you have any questions or feedback, please feel free to reach out to me on Matrix (@julienw:mozilla.org). You can also reach out to our team on Firefox Profiler channel on Matrix (#profiler:mozilla.org).
If you profiled something and are puzzled with the profile you captured, we also have the Joy of Profiling (#joy-of-profiling:mozilla.org) channel where people share their profiles and get help from the people who are more familiar with the Firefox Profiler. In addition to that, we have the Joy of Profiling Open Sessions where some Firefox Profiler and Performance engineers gather together on a Zoom call to answer questions or analyze the profiles you captured. It’s usually happening every Monday, and you can follow the “Performance Office Hours” calendar to learn more about it.
No comments yet
Comments are closed, but trackbacks are open.