At the end of last year we ran a user survey and transformed results into Pontoon roadmap for 2017. Since the top-voted feature (in-app notifications) was blocked by the runner-up (project priorities and deadlines), we started working on the latter. It’s now ready for you to consume.
Adding two columns for project priority and deadline to our dashboards shouldn’t be a big deal, but we also had other related requests to fullfil. Additionally, dashboard code was in desperate need of a rewrite. So we ended up with the biggest changset ever landing in Pontoon! A big thank you to jotes for his patience during the review process!
Now let’s have a closer look at some of the changes we have made. We’ll use team page as an example and explain differences to other views along the way.
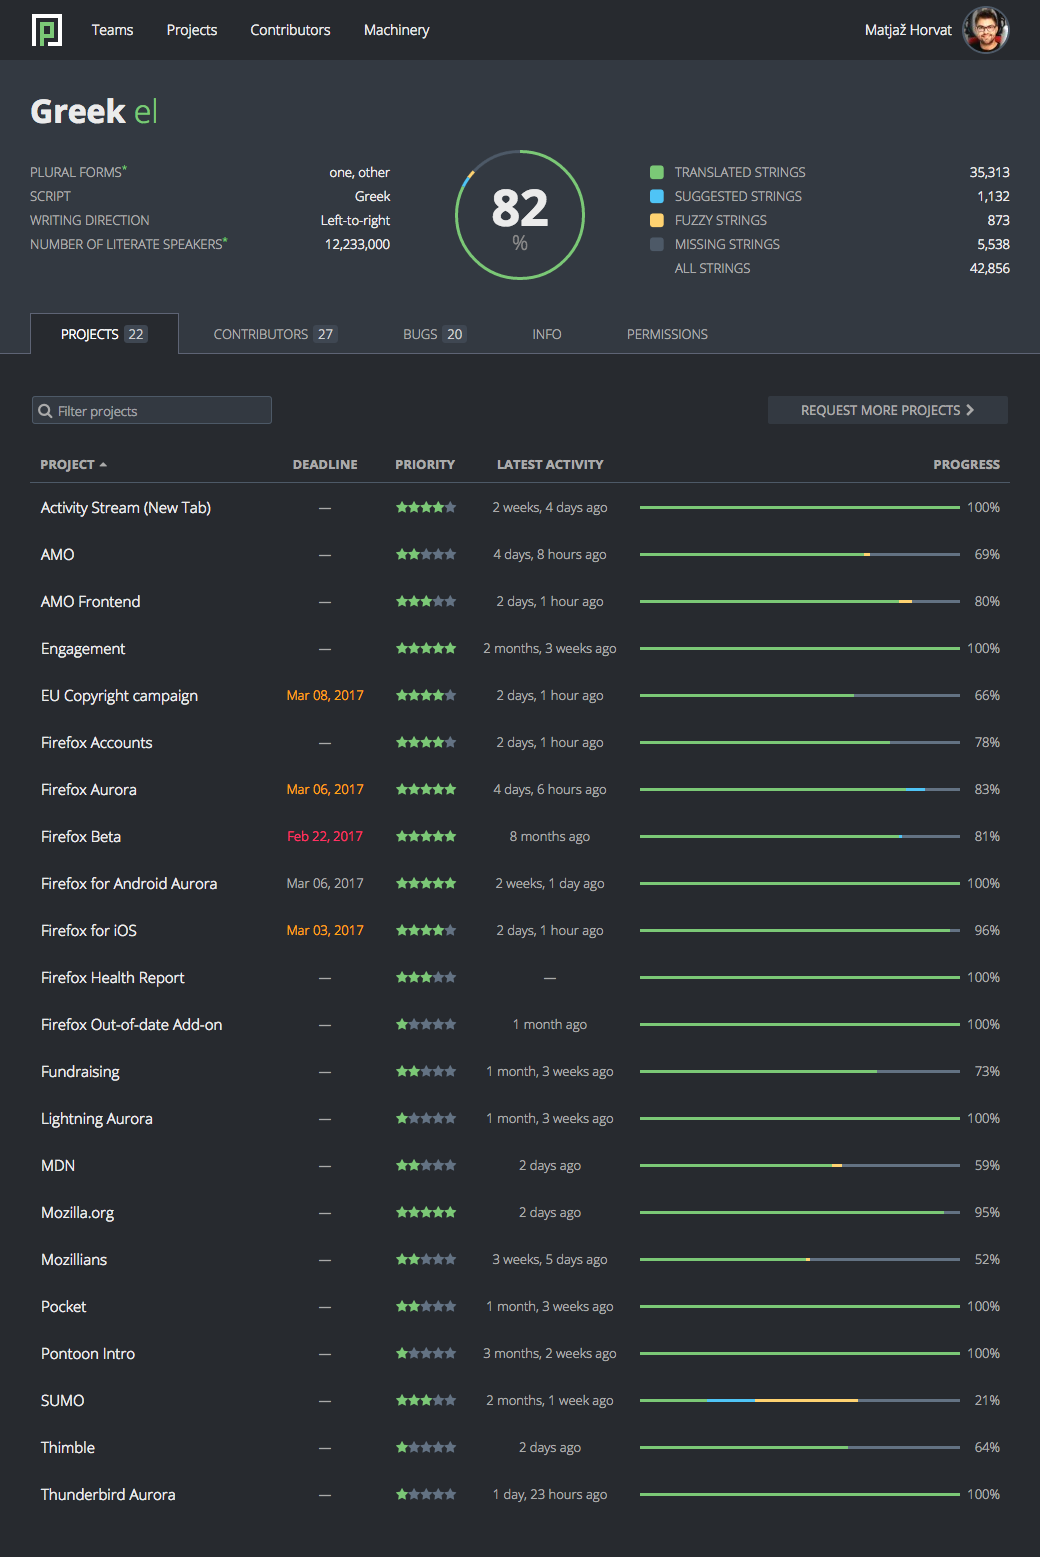
Greek Team Page
Main Menu
Starting on top, you’ll notice a simplified header with Pontoon logo, links to most popular views and the less frequent actions moved to the menu on the right. Note that Machinery was previously referred to as Terminology, but it’s the same old metasearch engine for translations.
Heading
The following section presents details of the current view, in our case team dashboard. On the left side you’ll find some CLDR locale data – plural forms, script, writing direction and the number of literate speakers. On the right side you’ll see overall team statistics.
Subpage Navigation
Team, Project and Localization (i.e. localization of a project by a team) dashboards consist of various subpages and you switch between them using tabs. As you’ll notice by the YouTube-like progress bar on top of the page, the navigation is now AJAX-based, which should make it faster.
Project Listing
Finally, in the project list below the tabs you’ll find the deadline and priority columns. If the deadline is overdue, it’s painted red. If it’s orange, you have less than a week to complete your translations. Projects are ranked in 5 priority levels, marked with stars.
Team dashboard now allows you to jump straight to the translate view with translation status filter applied. Hover any project to reveal its stats and select one of the translation statuses or “All strings”. A tooltip also appears when hovering in latest activity column, revealing the latest translation, author and date.
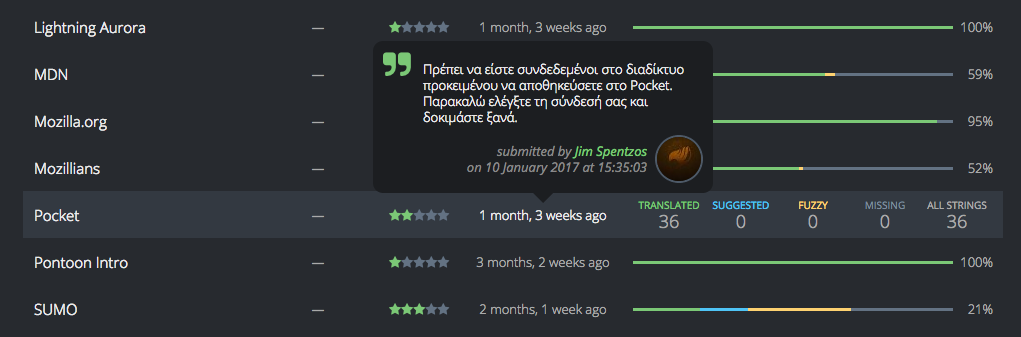
Jump straight to translate view with translation status filter applied
Bugzilla integration
Mozilla uses Bugzilla to track progress of projects and localizations. Open bugs specific to the team can now be accessed via the Bugs tab on the team page. Thanks to Axel, who wrote the code to support this functionality in Elmo, it’s now part of Pontoon too. Which means we’re now officially merging Pontoon and our standalone dashboard codebase!
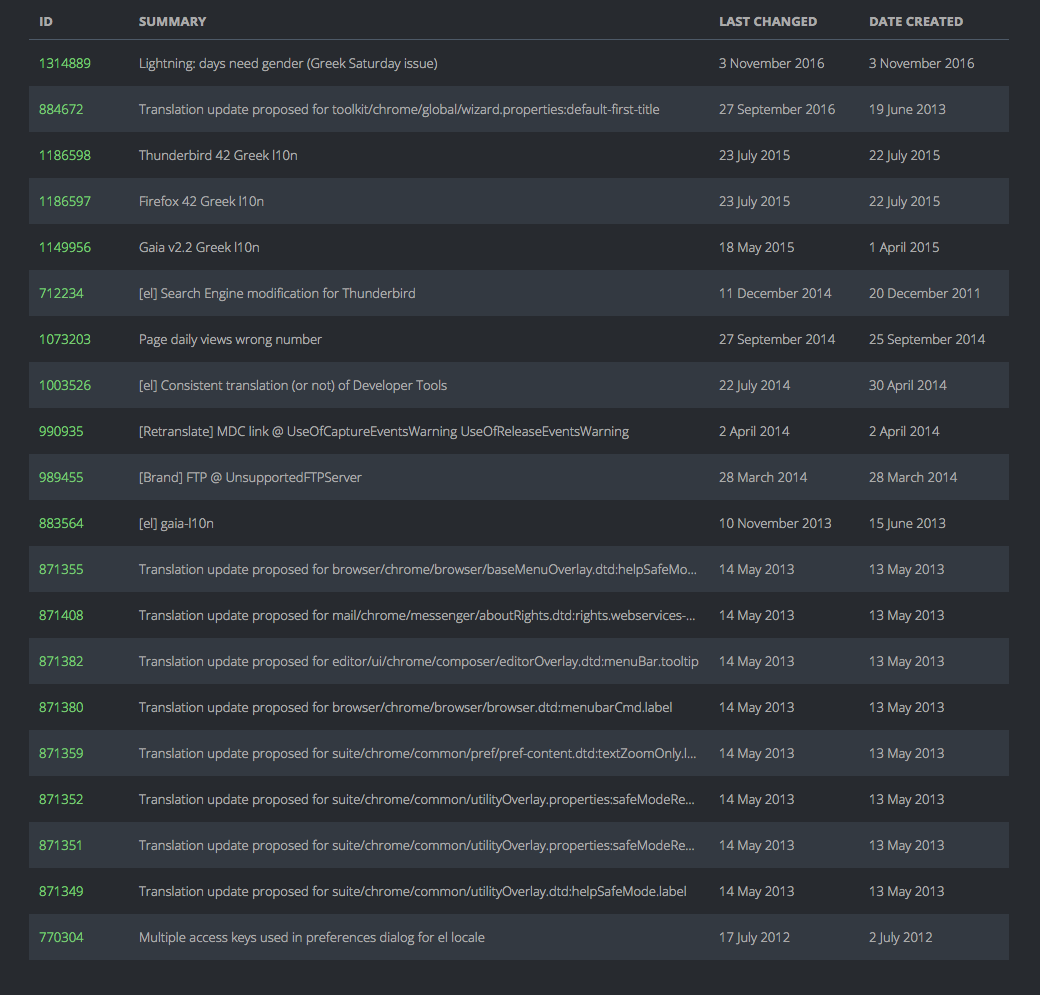
Open bugs for the Greek team
Other dashboards
Project and Localization dashboard share their layouts with the Team dashboard. You’ll notice some information not previously available, such as repository URL on the Project page and a list of contributors, project info and team info on the Localization page.
A look ahead
With these changes, our dashboards should not only become more powerful, easier to use and more pleasant to the eye, but also more flexible to adapt to future requests. There are plenty of things we could improve:
- Team dashboards could entirely replace our team wiki pages, reflecting team hierarchy and providing links to l10n resources like style guides.
- Project dashboards could contain links to l10n preview environments and contact information (l10n drivers, developers).
- Localization dashboards could contain deadline and priority information provided by the web dashboard.
Let us know how you feel about the new dashboards. And don’t forget, you can always file a bug or submit an idea for improvement! 😉
No comments yet
Post a comment